
Shizhen CAI, Xuliang ZHANG, Yinghui CAO, Zhaohui ZHANG, Wei WANG. Values of the Farmland Ecosystem Services of Qingdao City, China, and their Changes[J]. Journal of Resources and Ecology, 2020, 11(5): 443
- Journal of Resources and Ecology
- Vol. 11, Issue 5, 443 (2020)
Abstract
1 Introduction
The ecosystem provides humans with food and raw materials, and it is indispensable for sustainable development (
Farmland is a semi-natural ecosystem in which human beings produce agricultural products using natural resources and artificial inputs (
Since the end of the 20th century, great attention has been paid to evaluating ecosystem services (
As an international metropolis with a large population, the protection and wise use of the farmland ecosystem is particularly important for Qingdao City, especially at a time when its industrial economy is developing rapidly. On the basis of the ecosystem services value system of the Millennium Ecosystem Assessment, the values of farmland ecosystem services in Qingdao City in 1997, 2002, 2007, 2012 and 2017 were evaluated. Analyzing the value changes of farmland ecosystem services caused by agricultural production and land use changes can provide a scientific basis for agricultural production decision-making, rational allocation of agricultural resources, formulation of farmland utilization management policy and calculation of farmland ecological compensation standards in Qingdao City. In addition, this analysis can also help the public to fully understand the ecological utility of the farmland ecosystem, enhance the awareness of social public protection and the rational use of farmland, and promote the sustainable development of regional agriculture.
2 Overview of the study area
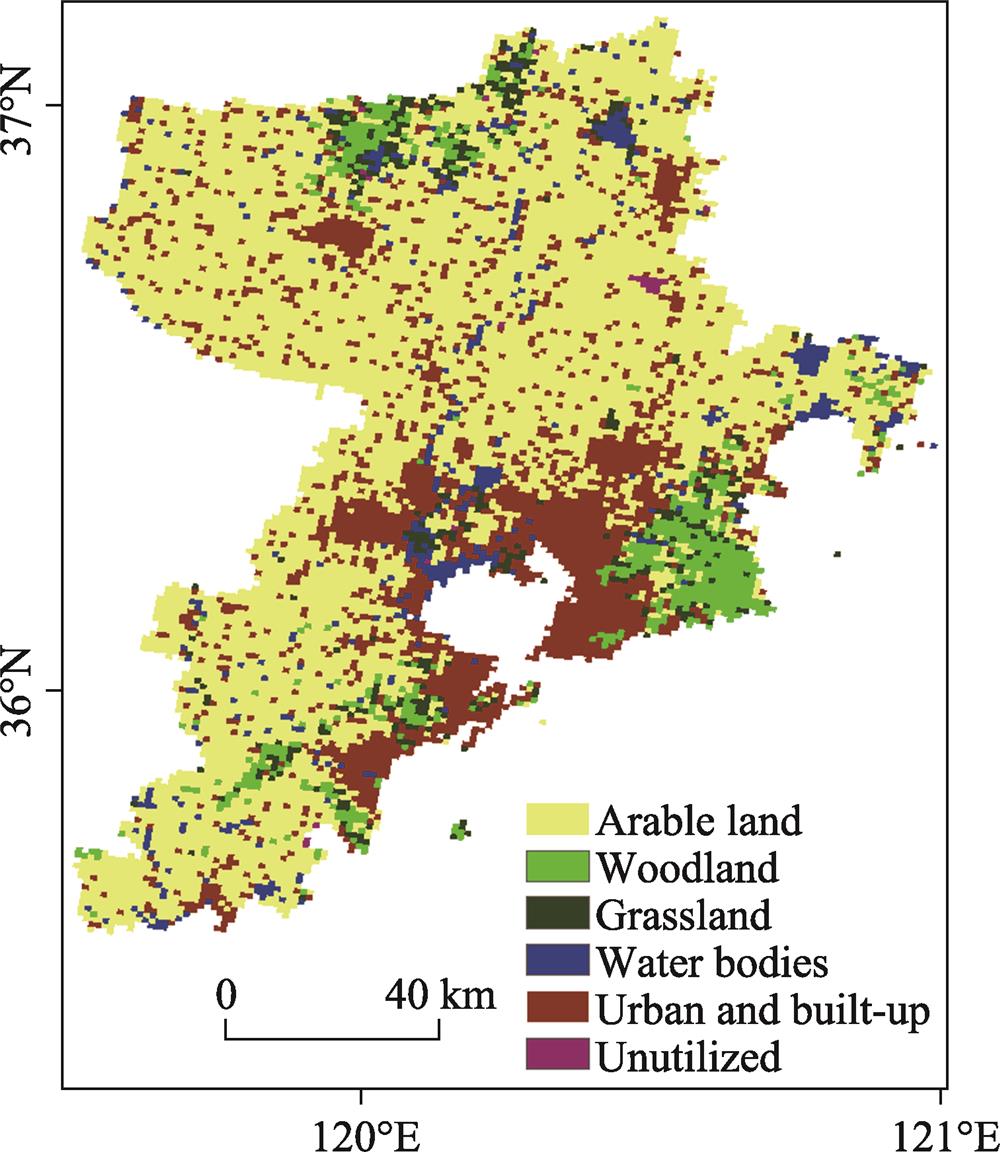
Qingdao City, Shandong Province (35°35°-37°09°N, 119°30°- 121°00°E) is located in the southwest of Shandong Peninsula, northern China. It is bordered by the Yellow Sea in the southeast, and by Yantai City, Weifang City and Rizhao City in the northeast and southwest, respectively. The terrain is high in the east and low in the west. The main types of landforms include plains, hills, mountains and coastal lowlands, accounting for 46.33%, 41.04%, 9.34% and 3.29% of the total land area, respectively. Among them, the plain is the main production area of grains, peanut, vegetables and cotton. Most of the hills have been reclaimed into farmland, with plantings of economic forests or wheat, corn, peanuts, sweet potato and so on; the mountainous areas are mostly used for forest, orchards and tourism; and the coastal lowlands are mostly used for maricultural ponds and salterns (
![]()
Figure 1.Fig. 1
Qingdao City has 7 districts and 3 county level cities: Shinan District, Shibei District, Licang District, Laoshan District, Huangdao District, Chengyang District, Jimo District, Jiaozhou City, Pingdu City and Laixi City. In 2018, there are a permanent resident population of 939.48×10⁴ people in the city. At the end of 2017, there was 51.86×10⁴ ha of cultivated land, mainly distributed in Laixi City, Pingdu City, Jiaozhou City, Jimo District and Huangdao District. The main crops are wheat, corn, peanut, potato, vegetables and fruits, and the total grain production of Qingdao City accounts for 6.29% of that of Shandong Province.
3 Research methods
3.1 Construction of the evaluation index system and data sources
According to the Millennium Ecosystem Assessment issued by the United Nations in 2005 and the actual agriculture in Qingdao City, the farmland ecosystem services in Qingdao City are divided into two categories, direct ecosystem services and indirect ecosystem services. Direct ecosystem services mainly refer to provisioning services, that is, agricultural product production and provisioning, while indirect ecosystem services mainly include regulating services, supporting services and cultural services. According to the above classification of farmland ecosystem services, the evaluation index system for farmland ecosystem services in Qingdao City was constructed, including 7 indexes and 10 calculation methods (
| Service type | Evaluation index | Meaning of index | Evaluation method | Calculating formula | Meaning of parameters | |
|---|---|---|---|---|---|---|
| Provisioning service | Product | Agricultural product production and provisioning | Market value method | ${{V}_{A}}\text{=}\sum\limits_{i=1}^{n}{{{m}_{i}}}\times {{p}_{i}}\times {{q}_{i}}$ | ||
| Regulating service | Carbon fixation service | Fixation of CO2 | Carbon tax method, afforestation cost method | $NPP=\sum\limits_{i=1}^{n}{\frac{{{Y}_{i}}(1-{{w}_{i}})}{{{f}_{i}}}}$ | ||
| Release of O2 | Industrial oxygen production method, afforestation cost method | |||||
| Water | Intercepting | Substitute cost method | ||||
| Maintaining water by the soil | Substitute cost method | |||||
| Climate | Enhancing | Equivalent factor method | $\begin{align} | |||
| Supporting service | Soil conservation service | Maintaining soil nutrients | Shadow price method | ${{V}_{S1}}={{Q}_{S}}\times \mathop{\sum }^{}{{S}_{j}}\times {{C}_{j}}\times {{P}_{j}}$ | ||
| Reducing land abandonment | Opportunity cost method | |||||
| Cultural service | Social security service | Guaranteeing | Substitute cost method | |||
| Entertainment and cultural service | Relaxation and entertainment | Equivalent factor method | $\begin{align} | |||
Table 1.
Evaluation index system of the farmland ecosystem service values in Qingdao City
The data of population, types and yields of agricultural products, soil characteristics, water resources and their utilization, agricultural production and living standards, and others, were obtained from the Qingdao Statistical Yearbooks, Shandong Statistical Yearbooks and China Price Yearbooks for 1998, 2003, 2008, 2013 and 2018; the Statistical Bulletin of National Economic and Social Development in Qingdao City, the Statistical Bulletin of National Economic and Social Development of Shandong Province in 1997, 2002, 2007, 2012 and 2017; as well as the History and Annuals of Qingdao—Agriculture Annuals, the History and Annuals of Qingdao—Physical geography/Meteorology annuals and other miscellaneous documents.
3.2 Methods of evaluating farmland ecosystem service values
3.2.1 Value of product provisioning service
Agricultural product production and provisioning are the most important farmland ecosystem services. The farmland in Qingdao City mainly produces grains, vegetables, melons and fruits and economic crops, among which wheat, corn, soybean, sweet potato and potato are the main food crops, while peanut, cotton and tobacco are the main economic crops. The value of the product provisioning service of the farmland ecosystem is calculated by the market value method, according to the current average market price of all the relevant types of agricultural products.
3.2.2 Values of carbon fixation service and oxygen release service
Atmospheric carbon dioxide is fixed in the form of organic carbon in agricultural products and soil organic carbon; meanwhile, oxygen is released through photosynthesis. According to the moisture contents and economic coefficients of the various crops, the net primary production, carbon fixation and oxygen release of the different crops can be calculated (
3.2.3 Value of water conservation service
The farmland ecosystem can prolong the formation of surface runoff and reduce the surface water loss through crop interception of precipitation, and it can also make use of the water maintained by soil capillary force to meet the needs of current plant growth and future water supply in order to achieve the water conservation service. The water conservation service value of the farmland ecosystem is composed of the value of the crop interception of precipitation service and the value of the farmland soil water retention service. Because the water conservation service of the farmland ecosystem has a similar function to that of a reservoir, its value is calculated by the alternative cost method, using the cost of constructing a reservoir with the same water conservation capacity.
3.2.4 Value of climate regulating service
Crop transpiration and farmland evaporation increase the humidity in the atmosphere of the surrounding farmland. Mesoscale convection induced by thermal and dynamic effects of the farmland ecosystem can promote the formation of precipitation and produce a rain enhancement effect (
3.2.5 Value of soil conservation service
The brown soil is distributed over the largest area in Qingdao City. The management level of the farmland ecosystem in brown soil areas is high, and the crop coverage rate is also high. The soil attached to crop roots can reduce the soil loss caused by raindrop splashing, wind erosion, surface runoff erosion and other factors (
3.2.6 Value of social security service
The farmland ecosystem provides all kinds of agricultural products for human beings, and it is an important guarantee for the farmer’s livelihood. The scale of the rural surplus labor force is large, but it is hidden, so it does not directly bring pressure to society that is as great as the urban unemployed population. If the rural surplus labor force does not have enough farmland for basic livelihood security, then the local government needs to pay the minimum level of living security for them. Therefore, we can regard the rural surplus labor force as the population who need to receive the minimum level of living security in rural areas, and according to the annual agricultural employment population in Qingdao City, China’s agricultural hidden unemployment rate is 48.6% (
3.2.7 Value of entertainment and cultural service
In the process of the development of agricultural civilization, farmland not only provides the important means of industries and livelihood for human beings, but also forms diverse agricultural cultures. It provides people with places for leisure, entertainment, tourism and for returning to nature, enjoying pastoral scenery and meeting people’s specific aesthetic needs (
4 Results
4.1 Composition of farmland ecosystem service values and their changes
4.1.1 Provisioning service value and its changes
The provisioning service value of the farmland ecosystem in Qingdao City showed an upward trend from 1997 to 2017, and only a slight decrease in 2007. The food producing service values of wheat, corn, peanut, vegetables and fruits accounted for a large portion of the total provisioning service values in the 5 years (
| Crop species | 1997 | 2002 | 2007 | 2012 | 2017 |
|---|---|---|---|---|---|
| Wheat | 33.27 | 20.74 | 29.03 | 37.08 | 31.60 |
| Corn | 8.47 | 11.39 | 16.92 | 23.54 | 22.72 |
| Soybean | 1.58 | 1.66 | 1.46 | 1.02 | 0.36 |
| Potato | 2.68 | 2.75 | 1.31 | 0.86 | 0.58 |
| Peanut | 21.73 | 35.86 | 34.62 | 36.99 | 32.23 |
| Cotton | 0.26 | 0.44 | 0.55 | 0.63 | 0.06 |
| Tobacco | 1.89 | 1.58 | 0.53 | 0.43 | 0.22 |
| Vegetable | 102.00 | 211.83 | 185.96 | 198.84 | 228.51 |
| Fruit | 37.03 | 57.05 | 62.55 | 63.53 | 65.52 |
| Total | 208.91 | 343.30 | 332.92 | 362.93 | 381.81 |
Table 2.
Provisioning service values of various crops of the farmland ecosystem in Qingdao City during 1997-2017 (×108 Yuan)
4.1.2 Values of carbon fixation service and oxygen release service and their changes
Based on the moisture content of various crops, economic coefficients and yearly actual yields per hectare, the total net primary productivities of various crops in Qingdao City in 1997, 2002, 2007, 2012 and 2017 were calculated (
| Crop | Moisture | Economic coefficient | Net primary productivity (×104 t yr-1) | ||||
|---|---|---|---|---|---|---|---|
| 1997 | 2002 | 2007 | 2012 | 2017 | |||
| Wheat | 12.50 | 0.37 | 374.71 | 256.81 | 330.05 | 365.33 | 298.94 |
| Corn | 13.50 | 0.49 | 131.20 | 193.25 | 264.33 | 319.65 | 294.87 |
| Soybean | 12.50 | 0.18 | 24.02 | 27.67 | 22.47 | 13.64 | 4.64 |
| Potato | 80.00 | 0.50 | 4.92 | 5.54 | 2.42 | 1.38 | 0.90 |
| Peanut | 10.00 | 0.43 | 64.51 | 116.73 | 103.81 | 96.17 | 80.30 |
| Cotton | 8.30 | 0.35 | 0.52 | 0.98 | 1.13 | 1.13 | 0.11 |
| Tobacco | 8.20 | 0.55 | 1.34 | 1.23 | 0.38 | 0.27 | 0.13 |
| Vegetable | 82.50 | 0.90 | 64.81 | 148.16 | 119.73 | 110.79 | 122.07 |
| Fruit | 77.50 | 0.70 | 25.71 | 43.45 | 43.90 | 38.60 | 38.15 |
| Sum | — | — | 691.74 | 793.83 | 888.22 | 946.96 | 840.10 |
Table 3.
Net primary productivities of various crops produced by the farmland ecosystem of Qingdao City in the 5 years
The oxygen release service value of the farmland ecosystem of Qingdao City was evaluated by the industrial oxygen production method and afforestation cost method, with the industrial cost of producing the oxygen of 400 Yuan t-1 and the average afforestation cost of 352.93 Yuan t-1 released by forest photosynthesis used as oxygen producing costs, respectively. In order to ensure the comparability of prices in different years, with 1985 as the base period, the calculated results of farmland ecosystem service values in the 5 years were translated into relative prices for 2017 based on the producer price index in 1985 for 1997, 2002, 2007, 2012 and 2017, namely 315, 292.6, 353.8, 393.4 and 376.2 Yuan t-1, respectively.
The values of the carbon fixation service and oxygen release service of the farmland ecosystem in Qingdao City increased gradually from 1997 to 2017 (
| Crop | Carbon fixation service value | Oxygen release service value | ||||||||
|---|---|---|---|---|---|---|---|---|---|---|
| 1997 | 2002 | 2007 | 2012 | 2017 | 1997 | 2002 | 2007 | 2012 | 2017 | |
| Wheat | 15.44 | 10.28 | 14.04 | 15.71 | 13.12 | 36.03 | 22.74 | 38.04 | 50.61 | 39.82 |
| Corn | 5.41 | 7.77 | 11.24 | 13.74 | 12.95 | 12.62 | 17.11 | 30.47 | 44.28 | 39.28 |
| Soybean | 0.99 | 1.11 | 0.96 | 0.59 | 0.20 | 2.31 | 2.45 | 2.59 | 1.89 | 0.62 |
| Potato | 0.20 | 0.22 | 0.10 | 0.06 | 0.04 | 0.47 | 0.49 | 0.28 | 0.19 | 0.12 |
| Peanut | 2.66 | 4.67 | 4.42 | 4.13 | 3.53 | 6.20 | 10.34 | 11.97 | 13.32 | 10.70 |
| Cotton | 0.02 | 0.04 | 0.05 | 0.05 | 0.01 | 0.05 | 0.09 | 0.13 | 0.16 | 0.01 |
| Tobacco | 0.06 | 0.05 | 0.02 | 0.01 | 0.01 | 0.13 | 0.11 | 0.04 | 0.04 | 0.02 |
| Vegetable | 2.67 | 5.93 | 5.09 | 4.76 | 5.36 | 6.23 | 13.12 | 13.80 | 15.35 | 16.26 |
| Fruit | 1.06 | 1.74 | 1.87 | 1.66 | 1.68 | 2.47 | 3.85 | 5.06 | 5.35 | 5.08 |
| Total | 28.50 | 31.77 | 37.79 | 40.71 | 36.88 | 66.52 | 70.29 | 102.38 | 131.18 | 111.91 |
Table 4.
Values of the carbon fixation service and oxygen release service of different crops of the farmland ecosystem in Qingdao City during 1997-2017 (×108 Yuan)
4.1.3 Value of water conservation service and its changes
Based on the area weighted average of annual precipitation of Qingdao City in 1997, 2002, 2007, 2012 and 2017, the thickness of the farmland soil layer was 22.88 cm, the soil non-capillary porosity was 11.94% (
| Item | 1997 | 2002 | 2007 | 2012 | 2017 |
|---|---|---|---|---|---|
| Annual precipitation (mm) | 575.27 | 481.03 | 1012.46 | 649.12 | 674.92 |
| Farmland area (×104 ha) | 76.03 | 77.40 | 76.31 | 74.86 | 70.04 |
| Value of intercepting precipitation by crops (×108 Yuan) | 3.08 | 2.77 | 7.03 | 5.59 | 4.16 |
| Value of maintaining water by soil (×108 Yuan) | 2.93 | 3.15 | 3.79 | 4.70 | 3.37 |
| Value of the water conservation service of farmland (×108 Yuan) | 6.01 | 5.92 | 10.82 | 10.29 | 7.53 |
Table 5.
Water conservation service value of the farmland ecosystem in Qingdao City during 1997-2017
4.1.4 Value of climate regulating service and its changes
According to the yields of major crops such as wheat, corn, potato and soybean of Qingdao City in the five years and the grain prices in the current year, the value of the food production and provisioning service of the farmland ecosystem per hectare was calculated; that is, the equivalent product provisioning service value was calculated, and then the equivalent climate regulating service value was calculated. The climate regulating service value of the farmland ecosystem was calculated by using the equivalent climate regulating service value and farmland area (
| Item | 1997 | 2002 | 2007 | 2012 | 2017 |
|---|---|---|---|---|---|
| Equivalent product provisioning service value | 0.43 | 0.58 | 0.65 | 0.77 | 0.74 |
| Equivalent climate regulating service value | 0.39 | 0.52 | 0.58 | 0.69 | 0.66 |
| Climate regulating service value | 29.35 | 39.99 | 44.27 | 51.61 | 46.28 |
Table 6.
Climate regulatory service value of the farmland ecosystem in Qingdao City during 1997-2017 (×104 Yuan)
4.1.5 Value of soil conservation service and its changes
The potential erosion modulus of cultivated land is 7060.42 t km-2 yr-1, and the actual erosion modulus is 335.37 t km-2 yr-1 in Qingdao City (
| Item | 1997 | 2002 | 2007 | 2012 | 2017 |
|---|---|---|---|---|---|
| Value of maintaining soil nutrients | 70.65 | 65.54 | 70.15 | 78.45 | 77.53 |
| Value of reducing land abandonment | 1.57 | 2.41 | 3.22 | 3.50 | 4.04 |
| Value of soil | 72.23 | 67.95 | 73.37 | 81.95 | 81.57 |
Table 7.
Soil conservation service value of the farmland ecosystem in Qingdao City during 1997-2017 (×108 Yuan)
4.1.6 Value of social security service and its changes
According to the population in the rural area which needs to receive the minimum social security, the annual consumption expenditure of rural residents per capita, the annual consumption expenditure of urban residents per capita and other relevant factors, the value of the social security services of the farmland ecosystem in Qingdao City was calculated by the substitute cost method (
| Item | 1997 | 2002 | 2007 | 2012 | 2017 |
|---|---|---|---|---|---|
| Rural population in Qingdao City (×104 people) | 155.20 | 121.38 | 102.30 | 104.95 | 101.86 |
| Population needing to receive minimum social security (×104 people) | 72.63 | 56.81 | 47.88 | 49.12 | 47.67 |
| Annual consumption expenditure of rural residents per capita (Yuan) | 2150 | 2820 | 4736 | 8653 | 12928 |
| Annual consumption expenditure of urban residents per capita (Yuan) | 5525 | 7344 | 13376 | 20391 | 30569 |
| Annual consumption expenditure of rural residents per capita to that of urban residents | 0.39 | 0.38 | 0.35 | 0.42 | 0.42 |
| Social security service value (×108 Yuan) | 21.37 | 16.49 | 12.82 | 15.76 | 15.24 |
Table 8.
Social security service value of the farmland ecosystem in Qingdao City during 1997-2017
4.1.7 Value of the entertainment and cultural service and its changes
The value of the entertainment and cultural service of the farmland ecosystem in Qingdao City was estimated by the equivalent factor method, using the value equivalence ratio of entertainment and cultural service to food production service (product provisioning service) of the farmland ecosystem as 0.01:1. The economic value of the food production service per unit area was multiplied by 0.01 to obtain the value equivalent of the entertainment and cultural service of the farmland ecosystem (
| Item | 1997 | 2002 | 2007 | 2012 | 2017 |
|---|---|---|---|---|---|
| Value equivalent of the food production service (×104 Yuan ha-1) | 0.43 | 0.58 | 0.65 | 0.77 | 0.74 |
| Value equivalent of the entertainment and cultural service (Yuan ha-1) | 43.38 | 58.06 | 65.18 | 77.45 | 74.24 |
| Value of the entertainment and cultural service (×104 Yuan) | 3298.16 | 4493.70 | 4973.97 | 5798.53 | 5199.81 |
Table 9.
Value and change of the entertainment and cultural service of the farmland ecosystem in Qingdao City during 1997-2017
4.2 Comprehensive analysis on the farmland ecosystem services value of Qingdao City
In the farmland ecosystem service value of Qingdao City, the value of the product provisioning service accounted for the largest proportion of the total, followed by the regulating service value, the cultural service value and the supporting service value. Generally, the proportions of the values of different services to the total were relatively stable during the period of 1997-2017; although the proportions of the values of different services to the total farmland service value were significantly different. In the 5 years which we analyzed, the combined proportions of the values of product provisioning, carbon fixation, oxygen release, and soil conservation services to the total farmland ecosystem service value was higher than 85%. The proportion of the product provisioning service value to the total was the largest and showed an increasing trend with fluctuation, indicating that the product provisioning of crops, especially those of grains, are the main farmland ecosystem service of Qingdao City. From largest to smallest, the values of farmland ecosystem services in Qingdao City are: the product provisioning service, the carbon fixation and oxygen release service, the soil conservation service, the climate regulating service, the social security service, the water conservation service, and the entertainment and cultural service (
In the period of 1997-2017, the total value of farmland ecosystem services in Qingdao City increased from 499.74×10⁸ to 681.74×10⁸ Yuan, and basically showed a steady increasing trend. Meanwhile, the value of the ecosystem services per hectare also increased, from 6.57×10⁴ in 1997 to 9.73×10⁴ Yuan ha-1 in 2017 (
![]()
Figure 2.Fig. 2
From 1997 to 2017, the farmland acreage decreased from 76.03×10⁴ ha to 70.04×10⁴ ha. Meanwhile, the value of direct services of the farmland ecosystem (i.e. the product provisioning service), as well as the value of indirect services (which include the regulating service, the supporting service and the cultural service) of the farmland ecosystem in Qingdao City, both showed upward trends, and the ratios of the values of indirect to direct services were 1.39, 0.68, 0.85, 0.91 and 0.79, respectively, showing an overall downward trend (
![]()
Figure 3.Fig. 3
5 Discussion
The proportions of provisioning service value, regulating service value, supporting service value and cultural service value to the total farmland ecosystem value in Qingdao City are in descending order, which is similar to those of Huailai County, Hebei Province in 2012 (
The importance of the indirect services value of the farmland ecosystem should be well recognized, so farmland should be reasonably utilized and effectively protected. Agricultural production should be developed reasonably based on the natural conditions of different regions, and agricultural production efficiency should be continuously improved by adopting scientific planting technology and efficient management to ensure the quality of agricultural products. We should promote supply-side structural reform in agriculture, make full use of the indirect service value of the farmland ecosystem (such as supporting service value and cultural service value), speed up the construction of modern agricultural parks, and develop ecological leisure agriculture and agricultural eco-tourism, thereby achieving the goal of providing maximum welfare for the human population through the farmland ecosystem.
In evaluating the values of the climate regulating service and the entertainment and cultural service of the farmland ecosystem in Qingdao City, only the positive service value of the farmland ecosystem was considered, and the loss of value caused by unreasonable agricultural activities, such as excessive fertilization, was ignored. Therefore, the actual value of the farmland ecosystem services should be slightly less than that reported in this paper, and that discrepancy should be further analyzed and discussed in the future research.
6 Conclusions
The farmland ecosystem provides the direct service of supplying agricultural products, indirect services of regulating service, supporting service and cultural service, and the service values of agricultural product provisioning, carbon fixation and oxygen release, water conservation, climate regulation, soil conservation, social security service, entertainment and cultural service, etc. Various methods (market value method, carbon tax method, afforestation cost method, industrial oxygen production method, substitute cost method, opportunity cost method and equivalent factor method) were used to evaluate the values of the farmland ecosystem services in Qingdao City in 1997, 2002, 2007, 2012 and 2017. The total value of the farmland ecosystem services in Qingdao City increased from 499.74×10⁸ to 681.74×10⁸ Yuan between 1997 and 2017, and the value of ecosystem services per hectare increased from 6.57×10⁴ to 9.73×10⁴ Yuan ha-1. The service values of product provisioning, carbon fixation and oxygen release, and soil conservation of the farmland ecosystem in Qingdao City accounted for the largest portion of the total ecosystem services value, which showed an upward trend, and they were the main farmland ecosystem services in Qingdao City. The supporting service value and the cultural service value of the farmland ecosystem in Qingdao City were low, but they still have great utilization potential.
References
[8] . History and annuals of Qingdao—Physical geography/meteorology annuals.(1997).
[11] Z Liu X, B Zhao Z, G Li K. Measurement of farmland ecosystem services evaluation in Beidaihe District, Hebei Province, China. Journal of Agricultural Resources and Environment, 34, 390-396(2017).
[15] Assessment Millennium Ecosystem. Ecosystems and human well- being: A framework for assessment(2005).
[17] Y Ouyang Z, Q Zhao T, Z Zhao J et al. Ecological regulation services of Hainan Island ecosystem and their valuation. Chinese Journal of Applied Ecology, 15, l395-l402(2004).
[21] D Simpson R. Conservation incentives from an ecosystem service: How much farmland might be devoted to native pollinators?. Environmental & Resource Economics, 73, 661-678(2019).
[22] Z Sun X, L Zhou H, D Xie G. Ecological services and their values of Chinese agroecosystem. China Population, Resources and Environment, 17, 55-60(2007).
[23] Y Sun, H Eerdun, S Du H. Application of vegetation cover in soil erosion modulus calculation. Bulletin of Soil and Water Conservation, 33, 185-189(2013).
[26] Q Wu S, C Lei J, M Wang J et al. Evaluation on farmland ecosystem service value in Wuma River watershed. Guizhou Agricultural Sciences, 45, 151-155(2017).
[28] D Xie G, Y Xiao. Review of agro-ecosystem services and their values. Chinese Journal of Eco-Agriculture, 2l, 645-651(2013).
[29] D Xie G, Y Xiao, L Zhen et al. Study on ecosystem services value of food production in China. Chinese Journal of Eco-Agriculture, 13, 10-13(2005).
[30] M Yan H, Y Liu J, K Cao M. Spatial pattern and topographic control of China’s agricultural productivity variability. Acta Geographica Sinica, 62, 171-180(2007).
[31] X Yang Z, W Zheng D, H Wen. Studies on service value evaluation of agricultural ecosystem in Beijing region. Journal of Natural Resources, 20, 564-571(2005).
[32] Q Ye Y, E Zhang J, Z Qin et al. Ecological benefit-loss analysis of agricultural ecosystem in Foshan City, China. Acta Ecologica Sinica, 32, 4594-4604(2012).
[34] G Zhang C, L Qiu. Comprehensive sustainability assessment of a biogas-linked agro-ecosystem: A case study in China. Clean Technologies and Environmental Policy, 20, 1847-1860(2018).
[35] D Zhang, S Li X, H Chen Y. Classification evaluation on agriculture ecosystem service value of Huailai County. Research of Soil and Water Conservation, 23, 234-239(2016).
[38] H Zhao. Research on risk assessment of soil and water loss in Qingdao based on RS and GIS. Ms. thesis, Jinan, China: Shandong Normal University(2017).

Set citation alerts for the article
Please enter your email address
© Copyright 2018-2021 | Chinese Laser Press. All Rights Reserved 沪ICP备15018463号-20