• Journal of Inorganic Materials
  • Vol. 36, Issue 10, 1059 (2021)
Wenqi FAN1, Xuemei SONG2, Yiling HUANG2, and Chengkang CHANG1、*
Author Affiliations
  • 11. School of Materials Science and Engineering, Shanghai Institute of Technology, Shanghai 201418, China
  • 22. Inorganic Materials Analysis and Testing Center, Shanghai Institute of Ceramics, Chinese Academy of Sciences, Shanghai 200050, China
  • show less
    DOI: 10.15541/jim20210013 Cite this Article
    Wenqi FAN, Xuemei SONG, Yiling HUANG, Chengkang CHANG. Structure Change and Phase Transition Distribution of YSZ Coating Caused by CMAS Corrosion[J]. Journal of Inorganic Materials, 2021, 36(10): 1059 Copy Citation Text show less
    (a) XRD pattern, (b) particle size distribution and (c) differential scanning calorimetry (TG-DSC) graph of CMAS powder
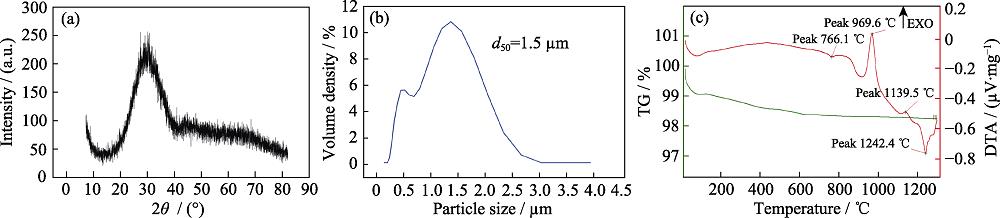
    1. (a) XRD pattern, (b) particle size distribution and (c) differential scanning calorimetry (TG-DSC) graph of CMAS powder
    (a) Secondary electron morphology of the natural section, (b) backscattered morphology of the polished cross section, and (c) enlarged backscattered image of red frame area in (b) of the sprayed YSZ coating
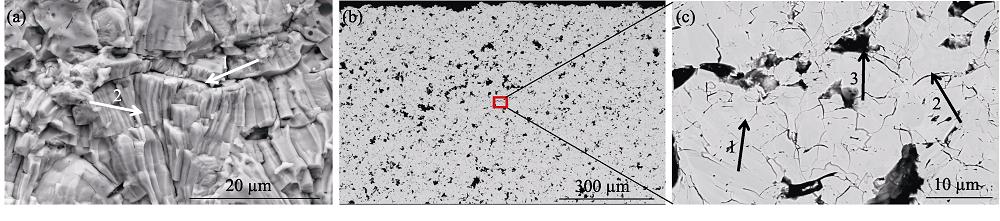
    2. (a) Secondary electron morphology of the natural section, (b) backscattered morphology of the polished cross section, and (c) enlarged backscattered image of red frame area in (b) of the sprayed YSZ coating
    XRD patterns of sprayed and high-temperature CMAS corrosive YSZ coating
    3. XRD patterns of sprayed and high-temperature CMAS corrosive YSZ coating
    (a) Cross-sectional backscatter SEM image of YSZ coating after 4 h corrosion by high-temperature CMAS; (b-e) EDS element mappings of frame (1-4), respectively
    4. (a) Cross-sectional backscatter SEM image of YSZ coating after 4 h corrosion by high-temperature CMAS; (b-e) EDS element mappings of frame (1-4), respectively
    Secondary electron images of cross-sections of the four different depth regions A, B, C, and D in the high-temperature CMAS corroded YSZ coating
    5. Secondary electron images of cross-sections of the four different depth regions A, B, C, and D in the high-temperature CMAS corroded YSZ coating
    (a) Local backscattering morphology of cross-section of the YSZ coating in the high temperature CMAS corroded state, (b) enlarged image of the red box 1 in (a), and (c) secondary electron magnified image of yellow dashed box area in (b), (d) magnified image of the red box 2 area in (a), (e) backscattering morphology of middle part of the high-temperature CMAS corroded YSZ coating, and (f) backscattering morphology of bottom of cross-section of the high temperature CMAS corroded YSZ coating
    6. (a) Local backscattering morphology of cross-section of the YSZ coating in the high temperature CMAS corroded state, (b) enlarged image of the red box 1 in (a), and (c) secondary electron magnified image of yellow dashed box area in (b), (d) magnified image of the red box 2 area in (a), (e) backscattering morphology of middle part of the high-temperature CMAS corroded YSZ coating, and (f) backscattering morphology of bottom of cross-section of the high temperature CMAS corroded YSZ coating
    (a) Secondary electron photograph and (b) corresponding EBSD phase diagram of sand-like grains of YSZ coating in high temperature CMAS corroded state Green: t-ZrO2; Red: m-ZrO2; White: CMAS Colourful images are available on website
    7. (a) Secondary electron photograph and (b) corresponding EBSD phase diagram of sand-like grains of YSZ coating in high temperature CMAS corroded state Green: t-ZrO2; Red: m-ZrO2; White: CMAS Colourful images are available on website
    EBSD phase distribution diagrams (a,c,e) and Euler angle diagrams (b,d,f) of the B, C, and D regions of the high-temperature CMAS corroded YSZ coating, respectively Images in (a,c,e), Green: t-ZrO2, Red: m-ZrO2, White: pore in the YSZ coating. Different colors in (b,d,f) represent different grain orientations. Colourful images are available on website
    8. EBSD phase distribution diagrams (a,c,e) and Euler angle diagrams (b,d,f) of the B, C, and D regions of the high-temperature CMAS corroded YSZ coating, respectively Images in (a,c,e), Green: t-ZrO2, Red: m-ZrO2, White: pore in the YSZ coating. Different colors in (b,d,f) represent different grain orientations. Colourful images are available on website
    XRFCaOMgOAlO1.5SiO2
    CMAS2314.0213.149.8
    Table 1. XRF chemical element molar percent composition of Ca22Mg19Al14Si45 powder/%
    EDS/wt%CaMgAlSiOYZr
    111.927.645.9623.3143.815.052.31
    211.017.085.6023.4344.435.702.76
    310.937.966.1223.5144.035.182.26
    411.297.155.7323.1343.475.195.02
    511.277.045.6422.7443.195.095.02
    60.650.410025.844.0169.09
    72.191.340.953.7428.713.4659.61
    82.591.921.304.9229.663.7055.92
    Table 2. EDS analyses of points 1-8 in Fig. 6(b, c)
    Wenqi FAN, Xuemei SONG, Yiling HUANG, Chengkang CHANG. Structure Change and Phase Transition Distribution of YSZ Coating Caused by CMAS Corrosion[J]. Journal of Inorganic Materials, 2021, 36(10): 1059
    Download Citation