
Fumika Isono, Jeroen van Tilborg, Samuel K. Barber, Joseph Natal, Curtis Berger, Hai-En Tsai, Tobias Ostermayr, Anthony Gonsalves, Cameron Geddes, Eric Esarey. High-power non-perturbative laser delivery diagnostics at the final focus of 100-TW-class laser pulses[J]. High Power Laser Science and Engineering, 2021, 9(2): 02000e25
- High Power Laser Science and Engineering
- Vol. 9, Issue 2, 02000e25 (2021)
Abstract
1 Introduction
High-power laser systems, targeting science at relativistic laser intensities (
The nonlinear physics at play in the high-power laser–plasma interaction makes applications highly sensitive to laser alignment. For example, transverse position jitter at focus of the order of 10 μm is problematic when short-scale plasma density features are present, when colliding or overlapping with multiple micrometer-sized laser foci[13–16], or when guiding intense laser pulses in plasmas[17,18]. Similarly, the pointing angle of the laser axis affects the coupling of the laser–plasma-produced secondary radiation (electron beams, X-rays, etc.) onto downstream beam and radiation optics such as quadrupole magnets. Hence, control of the position, pointing angle, and other laser parameters are key to high-quality laser applications.
Over recent years, LPA-relevant pioneering work has been performed on pointing correction[19] and wavefront-optimizing feedback loops[20]. Traditionally, high-power transverse focal position and angle are measured by monitoring the leakage of the last optic in the beam line[21]. However, because the leakage beam is transmitted through the mirror, vibrations and thermal motion of that specific mirror are not picked up by the leakage beam. In particular, with long-focal-length geometries, the vibrations on this last optic can translate into large position fluctuations at focus, uncorrelated to the leakage beam. In this paper, past limitations are overcome by the installation of a special final steering mirror (the last optic delivering the converging laser beam from the parabola towards focus), where its back-surface reflection of the main beam is used to provide on-line non-perturbative monitoring of the high-power laser focus position and angle in a two-camera setup. We refer to the beam reflected from the back surface as the ‘witness beam.’ This witness beam is a fully correlated copy of the high-power beam because it shares exactly the same mirror reflections.
Sign up for High Power Laser Science and Engineering TOC. Get the latest issue of High Power Laser Science and Engineering delivered right to you!Sign up now
In addition, such a witness beam diagnostic also lends itself to integration of pointing stabilization based on feedback concepts. As part of this paper we present data taken to quantify the system’s focal position and pointing angle fluctuations, by using both the low-power (~1 mJ at focus) high-repetition-rate (1 kHz) laser pulse train, as well as the low-repetition-rate (1 Hz) high-power (~2.5 J at focus) laser pulses. The low-power kilohertz pulse train is derived from the laser front-end. As both pulse trains originate from the same pulse train at upstream, with moderate thermal lensing of the amplifier crystals and kilohertz pulse having enough energy to be propagated, they have roughly the same beam size and the divergence through the whole system. This makes the low-power kilohertz pulse train well suited as the alignment beam. It carries the same vibrations as the high-power beam, from the source through the entire laser system, all the way to focus, which is not possible if the alignment beam is injected after amplifiers[19]. By propagating the low-power kilohertz pulses to focus, we observed focus position and pointing angle fluctuation dominated by frequencies below 70 Hz (consistent with spectra of equipment vibrations, air turbulence, among other effects). This encouraging finding supports the vision that if high-power laser systems were to become available at kilohertz repetition rates (which is currently being pursued by various groups[22,23]), fast feedback mechanisms using the witness beam technique demonstrated in this paper could be able to correct for the less than 70 Hz motion.
While awaiting such high-power kilohertz laser systems, we study the option of using the non-amplified kilohertz background pulse train to correct beam misalignments for the 1 Hz amplified high-power pulses. By simultaneously using two laser diagnostics (the witness beam diagnostic as well as a downstream mode-imager diagnostic), we measured the position and pointing angle correlation between the 1 Hz amplified pulses and the 1 kHz non-amplified pulse train. One key question we aimed to answer is whether the 1 Hz amplified pulses have a decreased correlation to temporally adjacent kilohertz background pulses owing to the 1 Hz amplification process (i.e., whether the pump laser and amplification process impart a temporary uncorrelated positional and angular kick to the 1 Hz amplified laser pulse). If that were the case, it would critically limit the option for fast feedback at few-hertz laser systems by using the non-amplified background laser. However, it will be presented that full-power measurements confirmed that the amplification process did not add a measurable uncorrelated contribution to the 1 Hz amplified pulses.
The work presented here demonstrates a very accurate non-perturbative high-power laser diagnostic, allowing shot-tagged laser delivery information on position and angle. The demonstrated correlation of the high-power laser pulse train to the non-amplified background pulse train highlights the option for feedback integration at bandwidths larger than the <70 Hz environmental fluctuations. This would allow significant improvements in stability, quality, and applicability of high-power laser systems.
2 Experimental setup
A schematic of the 100-TW-class laser system and online target chamber monitoring setup is shown in Figure 1. The titanium-sapphire-based chirped-pulsed-amplification laser system was built to serve the LPA-based Free Electron Laser project at the BELLA Center[24]. It has the capability to approach 100 TW-class peak power based on
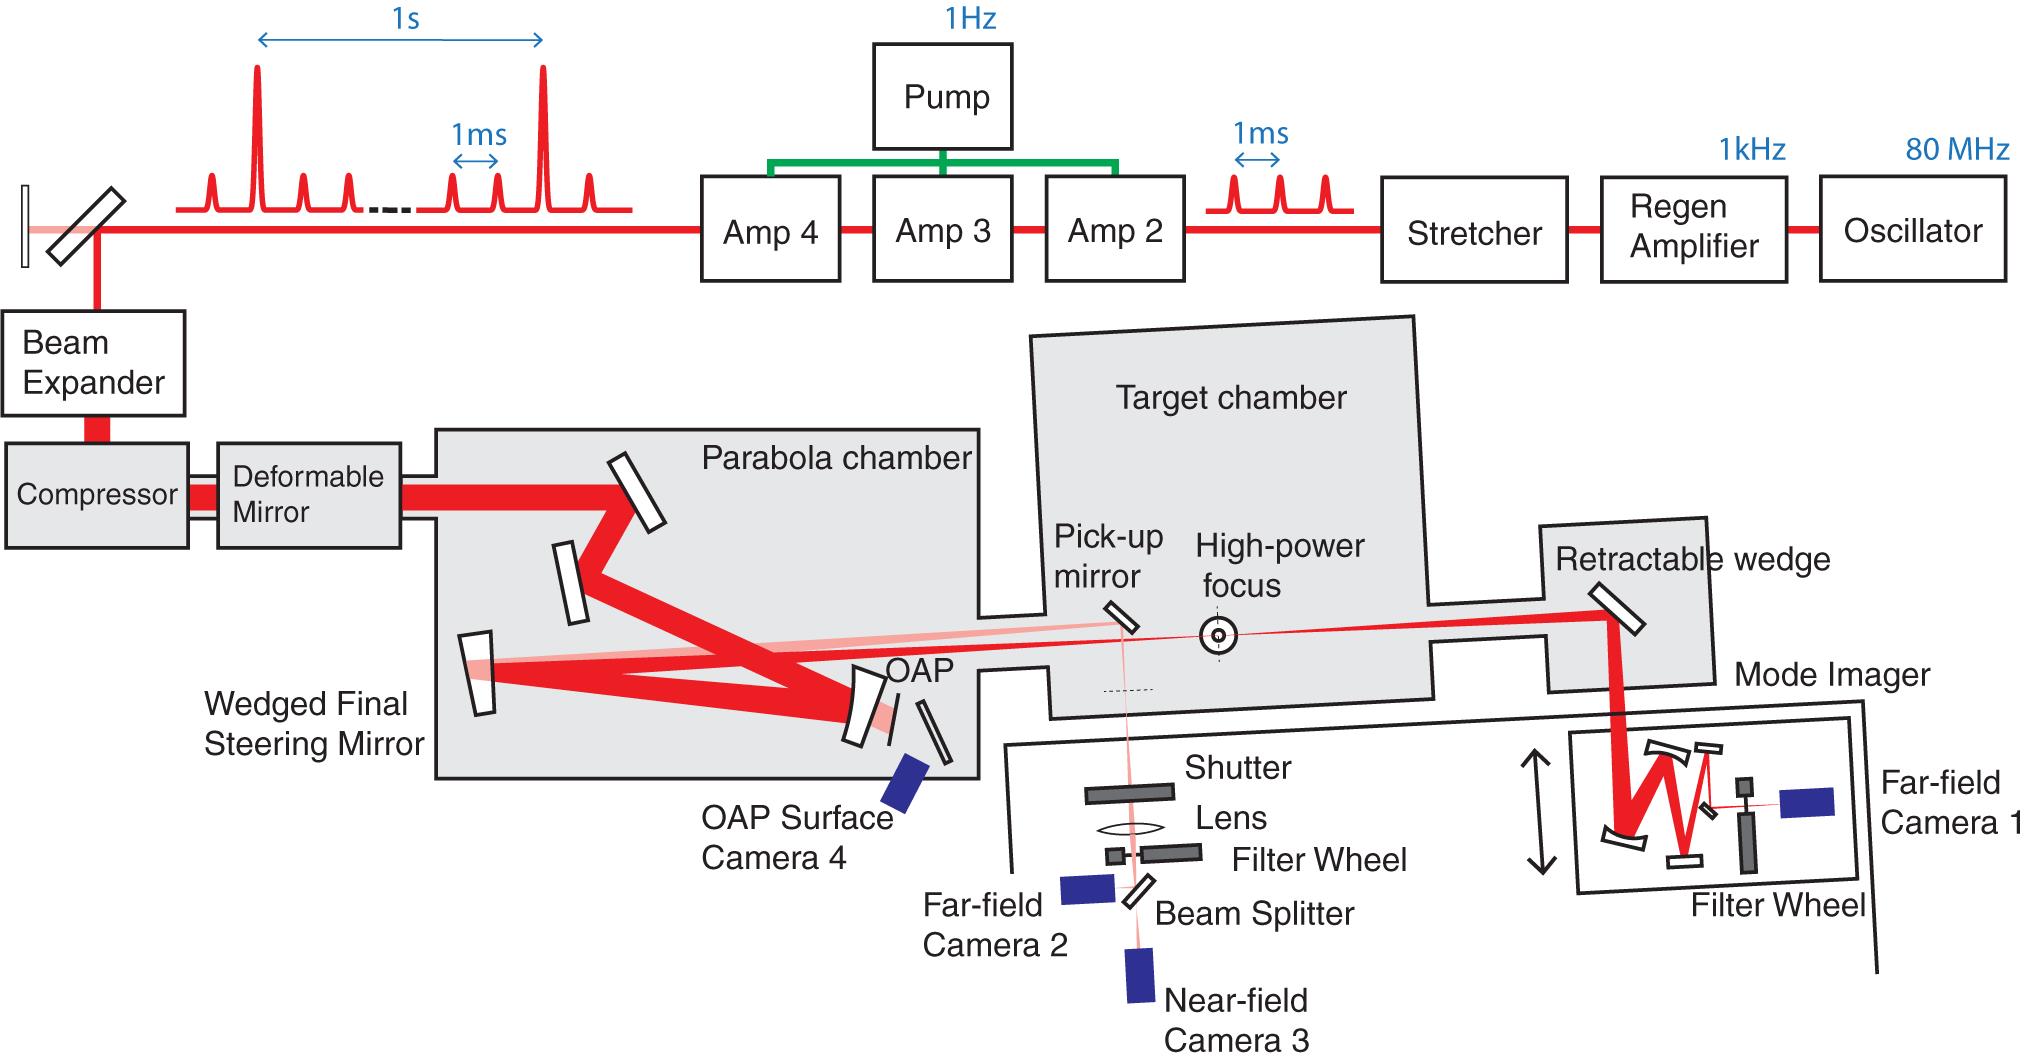
Figure 1.Experimental setup of the 100-TW-class laser system. A 1 kHz, 800 nm, 35 fs laser pulse train is produced in the regenerative amplifier (Regen) and stretched to 300 ps, and then every one in a thousand pulses is amplified in three successive multi-pass bow-tie amplifiers (Amp 2, 3, and 4). A single commercial pump laser (532 nm, ~16 ns pulse duration) is routed to all three amplifier Ti:sapphire crystals with 1 Hz repetition rate. The laser pulses are then compressed to 35 fs and focused into the target chamber, where a gas jet is placed for LPA experiments. The laser mode at focus is measured with two diagnostics: (1) a common mode imager (after insertion of the retractable wedge) with camera 1 recording the far-field laser profile by imaging the target chamber focus plane; and (2) a correlated witness beam setup, where a back-surface-reflected final steering mirror is routing a correlated copy of the main beam to a setup measuring the laser’s far-field (camera 2, imaging the target chamber focus plane) and quasi-near-field (camera 3, imaging a plane 44 mm downstream of the target chamber focus). The near-field beam profile at the off-axis parabolic mirror (OAP) surface is recorded by camera 4. Gray boxes represent vacuum chambers.
The commercial 1 kHz, 800 nm front-end laser is based on the Vitara oscillator from Coherent[25] coupled with the Legend Elite regenerative amplifier. The laser pulses contain 3 mJ and are stretched from 35 fs to 290 ps at the stretcher to prevent damage to optics during amplification. The pulse train is then propagated to amplifier 2 (a four-pass bow-tie amplifier), amplifier 3 (a three-pass bow-tie amplifier), and to amplifier 4 (a three-pass bow-tie amplifier). All three amplifier crystals are pumped by the same 16 J/shot 5 Hz pump laser (GAIA from Thales[26], 532 nm, ~16 ns pulse duration). The amplified pulse energy reaches 100 mJ after amplifier 2, 1 J after amplifier 3, and 4 J after amplifier 4, whereas its size increases from 6 mm FWHM to 12 mm before amplifier 3, and to 23 mm before amplifier 4. All Ti:sapphire crystals are water cooled.
Although the repetition rate (as set by the pump lasers) can operate up to 5 Hz, in this study we operated the pump laser at 1 Hz repetition rate. In this mode, the pulse train coming out of the amplifiers consists of amplified pulses separated in time by 1 s, and a train of unamplified background pulses separated by 1 ms. With the pump laser blocked, the remnant 1 kHz pulse train leaving the front-end system will be labeled as the ‘1 kHz non-amplified beam.’ Following the three amplifiers, the laser pulses are spatially expanded from 23 to 81 mm FWHM using the reflective-curved-mirror telescope with a magnification of 3.5×. After being routed into the vacuum system, the pulses are compressed to 35 fs (FWHM) with a grating compressor, and focused into the target chamber using an off-axis parabolic mirror (OAP) with focal length of 3 m. As shown in Figure 1, at 1 m downstream of the OAP a final steering mirror directs the converging beam to final focus.
The laser mode on target is measured by inserting an uncoated retractable wedge downstream of focus (hence ‘destructive’ to the path of electron beam propagating downstream), and routing the beam through a mode imager setup consisting of curved reflective mirrors and two more uncoated wedge reflections for appropriate attenuation onto far-field CCD camera 1 (Basler acA1300-22gm, 1.3 MP resolution, pixel size 3.75 μm
In addition to the mode imager setup, an alternative laser delivery monitor was developed. The copy of the high-power main beam was generated by the main beam reflected at the rear surface of the final steering mirror, which is wedged at an angle of 0.25°, has a 98% surface reflectivity on the front surface, and 80% reflectivity on the rear surface. Thus,
![]()
Figure 2.A single-shot transverse mode profile of the amplified beam captured by (a) camera 1 (mode imager) and (b) camera 2 (witness beam). (c), (d) Correlation of 100 consecutive high-power shots (at 1 Hz) of the main beam and witness beam centroids in horizontal and vertical direction, respectively.
3 Witness beam validation in high-power mode
To measure the correlation between the two diagnostics and to compare the main beam and the witness beam, synchronized far-field (focus) images on camera 1 (mode imager) and camera 2 (witness beam) were captured. Figure 2(a) shows a far-field mode of the main beam captured with camera 1, whereas Figure 2(b) shows a far-field mode of a witness beam captured with camera 2. The beam size measured with camera 1 was 46 μm FWHM. The mode imager point spread function (PSF), arising from a limited collected angle, was measured by temporarily placing a single-mode fiber tip at the target chamber focal plane (mode size less than 5 μm, see Figure 1). This measured PSF indicates a resolution limit of 25 μm FWHM, thus yielding a PSF-deconvolved target chamber focus beam size of
Figures 2(c) and 2(d) show the centroid correlations of 100 consecutive shots (with each shot
The witness-to-main beam Pearson’s correlation coefficient (measuring the degree of correlation) for these 100 shots (100 s of 1 Hz acquisition), as shown in Figures 2(c) and 2(d), was 0.98 and 0.97 in horizontal and vertical direction, respectively. Here, the Pearson’s correlation coefficient is defined as
![]()
Figure 3.(a), (b) Time series of 1 kHz non-amplified beam centroids in horizontal and vertical directions measured with far-field witness beam camera 2. The inset displays a zoomed-in sub-set of the first 500 shots. (c), (d) The amplitude  of the discrete Fourier transform
  of the time series (a) and (b), respectively, with
4 Non-amplified kilohertz beam focus position and pointing angle fluctuations
To investigate the source of pointing fluctuations in the 1 Hz amplified beam, we blocked the pump laser to the main amplifiers, and studied the non-amplified kilohertz pulse train focus position and pointing angle fluctuations. The far-field mode of the witness beam was recorded on camera 2 for 100 s at 1 kHz frame rate (N = 100,000 shots in total), with the centroids plotted in Figures 3(a) and 3(b). The standard deviation was 5.0 μm in horizontal direction and 6.5 μm in vertical direction, which is similar to the high-power fluctuations in Figure 2. This indicates that amplifying the beam does not increase fluctuation. Hence, within the resolution of our measurements, observed pointing fluctuations in the amplified 1 Hz beam can likely be corrected by steering mirrors based on fluctuations of non-amplified pulse train. Figures 3(c) and 3(d) show the intensity
Similarly to Figure 3, we recorded the optical axis angle
![]()
Figure 4.(a), (b) Time series of 1 kHz non-amplified beam pointing angle at focus in horizontal and vertical directions, derived from the far-field mode captured by camera 2 and the near-field mode captured by camera 3. (c), (d) The amplitude  of the discrete Fourier transform
  of the time series (a) and (b), respectively, highlighting the dominant components below 10 Hz.
Another method of interpreting the Fourier spectra of the centroid and pointing angle fluctuations is by computing the cutoff-integrated power spectral density[27]. The relation between the time-series standard deviation
Thus, the standard deviation of the fluctuations
Note that for
5 Main beam and witness beam centroid correlations
If the 1 Hz amplified beam were to receive a transient position and angle perturbation, for example during the sub-millisecond pumping process in the Ti:sapphire crystals, it would simply not be appropriate to use the non-amplified pulse train as an active feedback driver. In the previous sections we characterized the correlation of the amplified 1 Hz high-power pulse on the mode imager (the main beam) and the witness beam setup (witness beam), and we used the non-amplified 1 kHz pulse train to study the dominant spectral terms in the fluctuating position and angle at focus. Section 3 confirmed the witness beam as a correlated measurement of the main beam and Section 4 highlighted that most fluctuations are well below 70 Hz. This opens a promising path to using the kilohertz pulse train for fast active feedback laser delivery stabilization. A further requirement is the correlation between the 1 Hz amplified pulse properties to the kilohertz pulse train.
![]()
Figure 5.The standard deviation  of (a) the centroid fluctuations and (b) the angle fluctuations, with only frequencies above
  included in the standard deviation calculation. This representation of the spectral content is a complimentary way to interpret the Fourier transforms of the time series in
To measure the correlation of the amplified beam to the non-amplified beam, we took advantage of the fact that the trigger timing for the witness beam cameras can be selected. For example, for a given acquisition of the main amplified beam on camera 1, we triggered cameras 2 and 3 to record the non-amplified pulse 1 ms earlier. Note that in order not to damage the witness beam cameras while recording the non-amplified pulse, all attenuators were removed and a mechanical shutter with sub-millisecond close time was used to block the 1 Hz amplified beam. A schematic of the camera capture timings is shown in Figure 6(a). The Pearson’s correlation coefficients
![]()
Figure 6.(a) Illustration of the main beam and the witness beam timing with respect to the camera capture exposure. The example shows the  ms case when camera 1 (mode imager) captures the 1 Hz amplified main beam, whereas camera 2 captures the non-amplified pulse 1 ms earlier. (b) Correlation coefficients
  derived from the beam centroids measured with cameras 1 and 2, both for
  ms (blue bars) and
  ms (orange bars). We observe no significant degradation in
  at
at  ms, indicating that the main pulse has not picked up a random centroid fluctuation during the amplification process.
![]()
Figure 7.(a) Correlations of the main beam centroid at the OAP surface as captured with camera 4, and the pointing angle at focus captured with cameras 2 and 3 (witness beam diagnostic). Camera 4 always captured the main (high-power) 1 Hz pulses, whereas cameras 2 and 3 captured either the same pulse at  ms or the non-amplified pulse 1 ms earlier at
  ms. (b) Correlation coefficients
  for the plots in (a), showing that there are no significant differences in
  between
  ms and
  ms, supporting the claim that the amplification process does not impart significant random fluctuations in the target-chamber laser axis angle.
Noteworthy from Figure 6(b) is the observation that there is no significant difference in the correlation coefficient
We also simulated how the Pearson coefficient
6 Main beam and witness beam pointing angle correlations
When addressing pointing angle, unfortunately, unlike the cameras 2 and 3 witness diagnostic, the mode imager setup did not have the ability to measure the pointing angle of the main beam at focus. However, we can still use the beam centroid location at the OAP surface, as measured by CCD camera 4 (Basler acA1300-22gm) in Figure 1, to estimate the amplified laser pointing angle near focus. Indeed, as the top plots in Figure 7(a) show, there is high degree of correlation between the beam centroid on the OAP surface (camera 4) and pointing angle determined from the witness beam diagnostic. The Pearson correlation coefficient
To study the potential impact of the transient amplification process, we also executed a scan where the witness beam angle diagnostic recorded the pointing angle of the non-amplified pulse 1 ms earlier (at
7 Conclusion
An online non-perturbative monitor of the high-power laser delivery was installed on a 1-Hz 100-TW-class laser system, measuring both the transverse focus position and the pointing angle at focus. The diagnostic was based on a unique double-surface-coated wedged-mirror used as a final steering mirror, generating a highly correlated witness beam. Correlation at high-power operation was verified with a mode imager far-field camera.
In addition to 1 Hz high-power pulses, the 1 kHz non-amplified pulse train was also sent to the witness beam cameras. The 1 kHz non-amplified witness beam is well suited as an alignment laser, because it propagates with the amplified beam from the oscillator all the way up to the last reflection at the final steering mirror, with its beam size and the divergence matched with the amplified beam. By performing a Fourier analysis on the centroid and pointing angle time series, the spectra of the position and the angle fluctuations were characterized. Although the pointing angle fluctuations were dominated by environmental drivers below 10 Hz, the centroid fluctuations consisted both of low-frequency (<1 Hz) variations and various discrete contributions around 20, 40, and 50–70 Hz. By varying the camera trigger timing, it was verified that the amplified 1 Hz laser pulses did not accumulate random position and angle fluctuations during the amplification process by more than 0.5 μm and 0.01 mrad, respectively.
The various observations presented in this paper support the future concept that a less than 70 Hz bandwidth active feedback system, using the kilohertz non-amplified pulse train as sampling source, is sufficient to non-perturbatively stabilize the position and pointing angle of the 1-Hz-class high-power laser pulses by approximately a factor of five. This would present a significant advance in the stability and tunability of high-power laser applications such as laser–plasma accelerators, among others.
References
[1] M. Pittman, S. Ferré, J.-P. Rousseau, L. Notebaert, J.-P. Chambaret, G. Chériaux. Appl. Phys. B, 74, 529(2002).
[2] K. Nakamura, H.-S. Mao, A. J. Gonsalves, H. Vincenti, D. E. Mittelberger, J. Daniels, A. Magana, C. Toth, W. P. Leemans. IEEE J. Quantum Electron., 53, 1200121(2017).
[3] C. N. Danson, C. Haefner, J. Bromage, T. Butcher, J.-C. F. Chanteloup, E. A. Chowdhury, A. Galvanauskas, L. A. Gizzi, J. Hein, D. I. Hillier, N. W. Hopps, Y. Kato, E. A. Khazanov, R. Kodama, G. Korn, R. Li, Y. Li, J. Limpert, J. Ma, C. H. Nam, D. Neely, D. Papadopoulos, R. R. Penman, L. Qian, J. J. Rocca, A. A. Shaykin, C. W. Siders, C. Spindloe, S. Szatmári, R. M. G. M. Trines, J. Zhu, P. Zhu, J. D. Zuegel. High Power Laser Sci. Eng., 7, e54(2019).
[4] Z. Zhang, F. Wu, J. Hu, X. Yang, J. Gui, P. Ji, X. Liu, C. Wang, Y. Liu, X. Lu, Y. Xu, Y. Leng, R. Li, Z. Xu. High Power Laser Sci. Eng., 8, e4(2020).
[5] D. Strickland, G. Mourou. Opt. Commun., 56, 219(1985).
[6] A. J. Gonsalves, K. Nakamura, J. Daniels, C. Benedetti, C. Pieronek, T. C. H. de Raadt, S. Steinke, J. H. Bin, S. S. Bulanov, J. van Tilborg, C. G. R. Geddes, C. B. Schroeder, C. Toth, E. Esarey, K. Swanson, L. Fan-Chiang, G. Bagdasarov, N. Bobrova, V. Gasilov, G. Korn, P. Sasorov, W. P. Leemans. Phys. Rev. Lett., 122, 084801(2019).
[7] K. T. Phuoc, S. Corde, C. Thaury, V. Malka, A. Tafzi, J.-P. Goddet, R. Shah, S. Sebban, A. Rousse. Nat. Photonics, 6, 308(2012).
[8] A. R. Maier, N. Kajumba, A. Guggenmos, C. Werle, J. Wenz, N. Delbos, B. Zeitler, I. Dornmair, J. Schmidt, E. M. Gullikson, F. Krausz, U. Schramm, U. Kleineberg, S. Karsch, F. Gruner. Sci. Rep., 10, 5634(2020).
[9] M. Schnell, A. Sävert, B. Landgraf, M. Reuter, M. Nicolai, O. Jäckel, C. Peth, T. Thiele, O. Jansen, A. Pukhov, O. Willi, M. C. Kaluza, C. Spielmann. Phys. Rev. Lett., 108, 075001(2012).
[10] F. Isono, J. van Tilborg, S. Barber, C. Geddes, H.-E. Tsai, C. Schroeder, W. P. LeemansCLEO: Science and Innovations. , , , , , , and , in (), paper SF3I.1.(2019).
[11] P. Zeitoun, G. Faivre, S. Sebban, T. Mocek, A. Hallou, M. Fajardo, D. Aubert, P. Balcou, F. Burgy, D. Douillet, S. Kazamias, G. de Lachèze-Murel, T. Lefrou, S. le Pape, P. Mercère, H. Merdji, A. S. Morlens, J. P. Rousseau, C. Valentin. Nature, 431, 426(2004).
[12] S. Steinke, J. H. Bin, J. Park, Q. Ji, K. Nakamura, A. J. Gonsalves, S. S. Bulanov, M. Thèvenet, C. Toth, J.-L. Vay, C. B. Schroeder, C. G. R. Geddes, E. Esarey, T. Schenkel, W. P. Leemans. Phys. Rev. Accel. Beams, 23, 021302(2020).
[13] C. Geddes, C. Toth, J. Van Tilborg, E. Esarey, C. Schroeder, J. Cary, W. Leemans. Phys. Rev. Lett., 95, 145002(2005).
[14] C. Rechatin, J. Faure, A. Ben-Ismaïl, J. Lim, R. Fitour, A. Specka, H. Videau, A. Tafzi, F. Burgy, V. Malka. Phys. Rev. Lett., 102, 164801(2009).
[15] L.-L. Yu, E. Esarey, C. Schroeder, J.-L. Vay, C. Benedetti, C. Geddes, M. Chen, W. Leemans. Phys. Rev. Lett., 112, 125001(2014).
[16] B. Hidding, G. Manahan, T. Heinemann, P. Scherkl, F. Habib, D. Ullmann, A. Beaton, A. Sutherland, A. Knetsch, O. Karger, G. Wittig, B. O’Shea, V. Yakimenko, M. Hogan, S. Green, C. Clarke, S. Gessner, J. Rosenzweig, A. Deng, M. Litos, D. Bruhwiler, J. Smith, J. Cary, R. Zgadzaj, M. C. Downer, C. Lindstrøm, E. Adli, G. Andonian. 8th International Particle Accelerator Conference, 1252(2017).
[17] A. Gonsalves, K. Nakamura, C. Lin, J. Osterhoff, S. Shiraishi, C. Schroeder, C. Geddes, C. Tóth, E. Esarey, W. Leemans. Phys. Plasmas, 17, 056706(2010).
[18] B. Miao, L. Feder, J. Shrock, A. Goffin, H. Milchberg. Phys. Rev. Lett., 125, 074801(2020).
[19] G. Genoud, F. Wojda, M. Burza, A. Persson, C.-G. Wahlstrom. Rev. Sci. Instrum., 82, 033102(2011).
[20] S. J. D. Dann, C. D. Baird, N. Bourgeois, O. Chekhlov, S. Eardley, C. D. Gregory, J.-N. Gruse, J. Hah, D. Hazra, S. J. Hawkes, C. J. Hooker, K. Krushelnick, S. P. D. Mangles, V. A. Marshall, C. D. Murphy, Z. Najmudin, J. A. Nees, J. Osterhoff, B. Parry, P. Pourmoussavi, S. V. Rahul, P. P. Rajeev, S. Rozario, J. D. E. Scott, R. A. Smith, E. Springate, Y. Tang, S. Tata, A. G. R. Thomas, C. Thornton, D. R. Symes, M. J. V. Streeter. Phys. Rev. Accel. Beams, 22, 041303(2019).
[21] A. R. Maier, N. M. Delbos, T. Eichner, L. Hübner, S. Jalas, L. Jeppe, S. W. Jolly, M. Kirchen, V. Leroux, P. Messner, M. Schnepp, M. Trunk, P. A. Walker, C. Werle, P. Winkler. Phys. Rev. X, 10, 031039(2020).
[22] W. Leemans. , “Laser technology for k-BELLA and beyond,” Technical Report (Lawrence Berkeley National Laboratory, ).(2017).
[23] M. K. Weikum, T. Akhter, D. Alesini, A. S. Alexandrova, M. P. Anania, N. E. Andreev, I. A. Andriyash, A. Aschikhin, R. W. Assmann, T. Audet, A. Bacci, I. F. Barna, A. Beaton, A. Beck, A. Beluze, A. Bernhard, S. Bielawski, F. G. Bisesto, F. Brandi, R. Brinkmann, E. Bruendermann, M. Büscher, M. H. Bussmann, G. Bussolino, A. Chance, M. Chen, E. Chiadroni, A. Cianchi, J. A. Clarke, J. Cole, M. E. Couprie, M. Croia, B. Cros, P. A. Crump, G. Dattoli, A. D. Dotto, N. Delerue, S. D. Nicola, J. M. Dias, U. Dorda, R. Fedele, A. F. Pousa, M. Ferrario, F. Filippi, G. Fiore, R. A. Fonseca, M. Galimberti, A. Gallo, A. Ghaith, D. Giove, A. Giribono, L. A. Gizzi, F. J. Grüner, A. F. Habib, C. Haefner, T. Heinemann, B. Hidding, B. J. Holzer, S. M. Hooker, T. Hosokai, M. Huebner, A. Irman, F. J. Jafarinia, D. A. Jaroszynski, C. Joshi, M. Kaluza, M. Kando, O. S. Karger, S. Karsch, E. Khazanov, D. Khikhlukha, A. Knetsch, D. Kocon, P. Koester, O. S. Kononenko, G. Korn, I. Kostyukov, K. O. Kruchinin, L. Labate, C. L. Blanc, C. Lechner, W. Leemans, A. Lehrach, X. Li, V. Libov, A. Lifschitz, V. Litvinenko, W. Lu, O. Lundh, A. R. Maier, V. Malka, G. G. Manahan, S. P. D. Mangles, B. Marchetti, A. M. de la Ossa, J. L. Martins, P. D. Mason, F. Massimo, F. Mathieu, G. Maynard, Z. Mazzotta, A. Y. Molodozhentsev, A. Mostacci, A. S. Mueller, C. D. Murphy, Z. Najmudin, P. A. P. Nghiem, F. Nguyen, P. Niknejadi, J. Osterhoff, D. O. Espinos, D. N. Papadopoulos, B. Patrizi, V. Petrillo, M. A. Pocsai, K. Poder, R. Pompili, L. Pribyl, D. Pugacheva, P. P. Rajeev, S. Romeo, M. R. Conti, A. R. Rossi, R. Rossmanith, E. Roussel, A. A. Sahai, G. Sarri, L. Schaper, P. Scherkl, U. Schramm, C. B. Schroeder, J. Scifo, L. Serafini, Z. M. Sheng, C. Siders, L. O. Silva, T. Silva, C. Simon, U. Sinha, A. Specka, M. J. V. Streeter, E. N. Svystun, D. Symes, C. Szwaj, G. E. Tauscher, D. Terzani, N. Thompson, G. Toci, P. Tomassini, R. Torres, D. Ullmann, C. Vaccarezza, M. Vannini, J. M. Vieira, F. Villa, C. G. Wahlstrom, R. Walczak, P. A. Walker, K. Wang, C. P. Welsch, S. M. Wiggins, J. Wolfenden, G. Xia, M. Yabashi, J. Zhu, A. Zigler. J. Phys. Conf. Ser., 1350(2019).
[24] J. van Tilborg, S. K. Barber, F. Isono, C. B. Schroeder, E. Esarey, W. P. Leemans. AIP Conf. Proc., 1812, 020002(2017).
[25] https://www.coherent.com/. https://www.coherent.com/
[26] https://www.thalesgroup.com/en. https://www.thalesgroup.com/en
[27] J. L. Stanford, S. B. Vardeman. Statistical Methods for Physical Science(1994).
[28] J. Cohen, P. Cohen, S. G. West, L. S. Aiken. Applied Multiple Regression/Correlation Analysis for the Behavioral Sciences(2003).

Set citation alerts for the article
Please enter your email address
© Copyright 2018-2021 | Chinese Laser Press. All Rights Reserved 沪ICP备15018463号-20