
Kunlun CHEN, Xiaoqiong LIU, Xi CHEN, Yuqi GUO, Yin DONG. Spatial characteristics and driving forces of the morphological evolution of East Lake, Wuhan[J]. Journal of Geographical Sciences, 2020, 30(4): 583
- Journal of Geographical Sciences
- Vol. 30, Issue 4, 583 (2020)
Abstract
1 Introduction
Rapid industrialization and urbanization have promoted China’s fast economic growth and sustained social prosperity in the past three decades, which caused a large amount of consumption of resources and environment. Meanwhile, the problem of resources and environment in the context of global change has become a common one faced by all countries around the world. How to correctly handle the relationship between economic development and ecological environment has also become the focus of academic and international political attention (
Early studies of lake morphology mainly focused on the morphological characteristics of different lakes and the relationship between lakes and their areas (
Previous studies of lake morphology have produced useful results, mainly focusing on the dynamic changes in area and the morphology of the shoreline. The evaluation and analysis of lake morphological evolution and its application in various fields has been studied in depth, with a diverse range of results. The premise of any evaluation is based on the need for an in-depth understanding of the reasons for change, but research on the factors controlling the changes of lake morphology is relatively rare. Increasingly, researchers are simply trying to describe the factors responsible for the changes in lake morphology without adequate theoretical support and with a lack of detailed analysis. Thus, due to the existing research gap in this area, this study analyzed the temporal and spatial changes of the urban water body of East Lake and the factors influencing these changes over the past two decades, using topographic maps and RS images as basic data.
China’s spatial development strategy has experienced many rounds of “coastal openness”, “western development”, and “the rising strategy in central regions” in recent decades. It has focused on economic construction and social development from the perspective of spatial cascade development. In 2014, the “Yangtze River Economic Belt Strategy” became a major national strategy, which redefined China’s spatial development strategy. While pursuing spatial and economic development, there has been an emphasis on the comprehensive regional development model that enables a deep spatial integration from the perspective of river basins. The pursuit of regionally coordinated development highlights the importance of resources and the environment. The Yangtze River Basin is an important economic zone, with the area supporting China’s social and economic sustainable development and regionally balanced growth, both in terms of its spatial location and resource environment (
Wuhan is a metropolis characterized by water due to it containing stretches of the Yangtze and Hanshui rivers as well as many other lake resources. Lake environmental protection has always been an important issue, which has attracted great attention from both the academic community and the government. In recent years, with the continuous expansion of urban built-up land, the lake water system in the central urban area has been eroded and the lake area has seriously declined. It is the region of the Yangtze River Valley that has experienced the most obvious dynamic changes. As a result, the area of urban lakes has strikingly decreased (
2 Methods
2.1 Study area
Wuhan (113°41′-115°05′E, 29°59′-31°22′N) is the core city of central China with an area of 8596 km2. It is an important transportation hub in China and is the largest industrial city and economic center in the Yangtze River Economic Belt. Wuhan city covers a built-up area of 460 km2 and has a population of about 10.77 million.
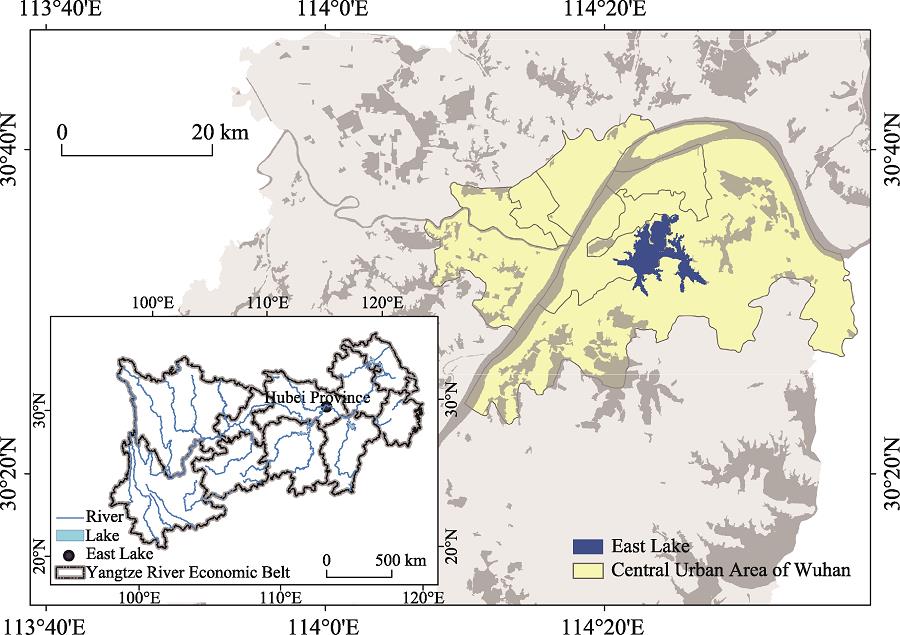
East Lake (114°20′57′-114°27′42″E, 30°30″56″-30°36′4″N) is located on the south bank of the Yangtze River, covering an area of 33 km2, which is six times the area of West Lake in Hangzhou. As an urban lake on the eastern edge of Wuhan (
![]()
Figure 1.
The lake has a subtropical climate, with a mean annual temperature ranging from 15.8 to 17.5℃ and an annual precipitation of 1205 mm. Heavy precipitation (~80%) occurs in the rainy season from April to August.
2.2 Data collection
An important criterion in selecting satellite images for the analysis of changes in a lake is the consistency in the acquisition date of the images. In addition, all images should be cloud-free. In this study, Landsat TM images acquired on December 5, 1995, and Landsat TM/ETM+ images acquired on December 8, 2005 and November 26, 2015 were selected to extract the surface area of East Lake. All images were cloud-free. The study area was entirely contained within path 123, row 39 for Landsat TM/ETM+. Images were downloaded from the United States Geological Survey (
A radiometric correction of the images had already been conducted by NASA. Accurate geometric correction is essential for the spatial analysis of change detection, because the potential exists for registration errors to be interpreted as lake or landscape changes, leading to an overestimation or underestimation of the actual change. This geometric correction was used to perform image-to-image rectification of the images from 1995, 2005, and 2015 using the Auto-sync model of ERDAS 9.3, with a root mean square error (RMSE) of less than 1 pixel. The Landsat images were rectified to the Universal Transverse Mercator (UTM) projection system (spheroid WGS 84, datum WGS 84, zone 50).
2.3 Methods
2.3.1 Normalized difference water index (NDWI)
The use of the NDWI for delineating an open water body was introduced by
where BMIR represents the MIR band, and BNIR represents the NIR band.
2.3.2 Landscape shape index (LSI)
The LSI was introduced to analyze the intensity of landscape interference by human activities (
where L represents the total length of all patch boundaries of East Lake and A is the total area of East Lake.
2.3.3 Centroid method
The centroid is an important indicator for describing the spatial distribution of geographic objects (
In equations 3-6, Qx is the integration of the x-axis; Qy is the integration of the y-axis; the value of (yi+1-yi) and (xi+1-xi) represent the difference of two adjacent points on the y-axis and the x-axis, respectively; A is the polygon area; x′ and y′ are the centroid coordinates of the polygon; and Lt+1 is the transfer distance of the centroid coordinates from time t to time t+1. The direction of East Lake’s evolution can be measured by comparing the position of the centroid in different periods.
3 Results
3.1 Changes in the area of East Lake
The area of East Lake decreased by 3.13 km2 from 1995 to 2015, accounting for 9% of its whole surface area. However, this downtrend improved during the period of 2005-2015. From 1995 to 2005, the area of East Lake decreased by 2.13 km2, accounting for 6% of its entire area. Between 2005 and 2015, the area of East Lake still declined, but at a slower rate, with the area decreasing by 1 km2 in total, accounting for 3% of the lake’s whole surface area (
| Period | Area (km2) | Perimeter (km) | Distance (km) |
|---|---|---|---|
| 1995-2005 | -2.13 | -21.89 | -0.58 |
| 2005-2015 | -1 | -0.67 | -0.08 |
| 1995-2015 | -3.13 | -22.56 | -0.66 |
Table 1.
Changes in the morphology of East Lake
![]()
Figure 2.
3.2 Changes in the length of the shoreline
The length of East Lake’s shoreline decreased between 1995 and 2015, which was consistent with the change in its area. It can be seen from
![]()
Figure 3.
3.3 Changes in the landscape shape index
It can be seen from
The LSI of East Lake declined from 7.04 in 1995 to 6.46 in 2005 and then to 6.38 in 2015. The LSI of East Lake decreased by 0.58 between 1995 and 2005, and then decreased by 0.08 from 2005 to 2015 (
![]()
Figure 4.
3.4 Changes in the lake centroid
There were obvious changes in East Lake’s spatial heterogeneity, with the centroid shifting to the southeastern part of the lake from 1995 to 2015. The movement of the centroid reflects the dynamic changes of East Lake (
![]()
Figure 5.
In general, the centroid of East Lake moved in an inverted “V-shaped” pattern. In terms of its orientation, the inverted “V-shaped” pattern reflected that the spatial direction of Wuhan’s urban development was consistent with the changes of the East Lake centroid. From the perspective of spatial balance, in the early stage of urban development, an unbalanced development strategy is generally adopted, with a focus on the development of a certain region. Over time, the overall strength of the development increases and the principle of an overall balance is taken into account to ensure the spatial balance of development.
4 Discussion
4.1 The relationship between centroid change and urban development
The centroid of East Lake first moved toward the northeast and then to the southeast. According to the image analysis, East Lake was on the outskirts of the urban built-up area in 1990, while the southern and western parts of East Lake were adjacent to downtown Wuhan. However, the western and southern parts of East Lake were the main areas of urban expansion between1995 and 2005, especially in the southwest. East Lake has been an urban lake since 1990. During this period, the southern and western parts of East Lake were filled-in to accommodate the East Lake high-tech development district (
![]()
Figure 6.
During 2005-2015, with the construction of Wuhan high-speed railway station in the northeast of East Lake (
![]()
Figure 7.
Urban development began in Wuhan between 1995 and 2005. At this time the intensity of human activity was not very high. During 2005-2015, Wuhan experienced rapid economic growth and urban expansion, which had a great impact on the southeastern part of East Lake. Therefore, the shift of the centroid to the southeastern region in recent years was much greater than the shift toward the northeastern region during the earlier period, which was consistent with the rapid development of East Lake. However, there was an overall tendency for a shift toward the southeastern part of the lake over the whole study period. Similar to East Lake, Taihu Lake and Chaohu Lake (
4.2 Analysis of the causes of the morphological evolution of East Lake
For thousands of years, Wuhan city has had a good reputation in terms of its urban water system. However, in recent decades, human activities have been impacting on the natural system due to urban development and expansion, resulting in the filling-in of the lake area, flow interruption, channelization, revetment hardening, and destruction of the wetland system. Most researchers believe that there are four main factors affecting the morphology of urban lakes in Wuhan, especially East Lake: infrastructure construction, the growth in urban housing, development of scenic spots for tourism, and illegal building construction (
4.2.1 Infrastructure construction
In recent years, urbanization in Wuhan has occurred with a remarkable pace of development. The built-up area increased from 234.23 km2 in 1995 to 566.13 km2 in 2015. The urbanization process in Wuhan developed steadily from 1995 to 2005, with the characteristics of an outward expansion in urban construction (
![]()
Figure 8.
![]()
Figure 9.
4.2.2 Development of urban housing
The surrounding natural features, such as lakes and mountains, have always been the focus of real estate development due to their attractive environment. As an area where lakes are concentrated, the Yangtze River Basin has attracted the attention of developers. As the most typical urban lake in the Yangtze River Economic Belt, the real estate development activities around the lake in the past decade have been very intense (
![]()
Figure 10.
4.2.3 Development of scenic spots for tourism
East Lake is a national 5A scenic area, and is the most important tourist location in Wuhan due to the scenic views of East Lake and its wetland resources. The exploitation of East Lake for tourism started in the 1950s with the formation of six sightseeing districts with distinctive features: Tingtao, Moshan, Luohong, Luoyan, Chuidi, and Baima scenic spots. Tingtao and Moshan scenic areas were the first East Lake tourism developments. Luoyan, Chuidi, and Baima scenic areas were developed from the 1990s, which was the time that East Lake began experiencing morphological changes (
![]()
Figure 11.
4.2.4 Illegal construction
Alongside the formal developments undertaken by large real estate companies, the illegal occupation of land by small enterprises and individuals is also an important factor affecting the evolution of the lake. Demands for economic benefits and an improved living environment are prevalent in cities throughout the Yangtze River Economic Belt, and have become important driving factors affecting changes in natural features, such as lakes and mountains. The impact of human activity on the morphological evolution of East Lake is recognizable both in the short-term and at large-scales. The influence of illegal construction and development is subtle and occurs over the long-term. The East Lake area is a national 5A scenic area. Therefore, a variety of tourism-related industries have been established to promote the industry, such as hotels and small attractions. Furthermore, many villages were distributed in the East Lake area. The value of land continually increased with the urban expansion and development of East Lake scenic areas. The villagers discretely built a large number of illegal buildings (
![]()
Figure 12.
4.3 The mechanisms controlling the morphological changes of East Lake
The main driving forces of the morphological changes of East Lake were human activities along the lake, including infrastructure construction, real estate development, illegal construction, and the development of scenic sites for tourism. The reason for the importance of these driving forces is the demand for significant amounts of land with the rapid increase of population, economic development, and urbanization of Wuhan city during 1995-2015. Population, GDP, and urbanization rate data obtained from the Wuhan city yearbooks during 1996 to 2016 (
There was a steady and rapid increase in the urban population of Wuhan from 1995 to 2015 (
![]()
Figure 13.
During the research period, the urbanization rate of Wuhan tended to be consistent with the changing trend of its urban population, and the annual growth of the urbanization rate was slightly higher than the annual growth rate of the population (
![]()
Figure 14.
Wuhan’s GDP displayed an exponential growth trend between 1995 and 2015 (
![]()
Figure 15.
The mechanism by which lake morphology evolves is a comprehensive system composed of elements of the human and social environment. The logical relationships among these driving forces are shown in
![]()
Figure 16.
5 Conclusions
Currently, under the guidance of the “Yangtze River Protection” principle in the Yangtze River Economic Belt Development Plan Outline, Wuhan has transformed its development strategy to treat the management of the city river valley environment as the dominant issue. In addition, as one of the most important cities in the Yangtze River Valley, the government of Wuhan has focused on developing the Yangtze River Economic Belt into a green ecological development zone and enhancing the comprehensive management of the river basin environment. Remote sensing and GIS were used to analyze the changes and landscape characteristics of East Lake in Wuhan from 1995 to 2015. The aim was to explore the changes of urban lake characteristics under the background of urbanization and to provide a reference for regional research and urban and scenic area planning and management.
(1) In the past 20 years, the water body of East Lake has experienced dramatic changes. The lake surface area and the shoreline length have continuously decreased. The annual shrinkage rate accelerated in the period between 1995 and 2005 compared with previous decades.
(2) The LSI values were 7.04 (1995), 6.46 (2005), and 6.38 (2015), indicating an acceleration in the declining trend as the shape complexity of the water body was decreasing and human intervention was intensifying. The main drivers of the changes in the water body were infrastructure construction, urban housing development, illegal construction, and the development of scenic areas for tourism.
(3) The centroid of East Lake moved to the northeast and then to the southeast during the period studied. This indicates that urban expansion affected the west and south of East Lake during 1995-2005, and then affected the northwest of the lake from 2005 to 2015. The trend was in accordance with the urban development of Wuhan city.
(4) The morphological evolution of East Lake was mainly affected by human activities. The effect of organized and large-scale urban development has been dramatic. However, the impact of small illegal constructions encroaching on the water body of East Lake should be given more attention regarding their complexity and continuity.
(5) This study investigated the changes and landscape evolution of East Lake during 1995-2015 in a rapidly urbanizing area of central China, using multi-temporal Landsat TM and ETM+images. As the largest and the most typical urban lake among the many lakes in the Yangtze River Economic Belt, East Lake has been greatly influenced by the development of Wuhan city and even the development of the Yangtze River Economic Belt. It is a good example of the changes in lakes in the Yangtze River Basin under the influence of urbanization in the Yangtze River Economic Belt. The research methods adopted in this study can be used to further investigate other lakes affected by urbanization in the Yangtze River Basin.
References
[1] L Chen K, X Wang, D Li et al. Driving force of the morphological change of the urban lake ecosystem: A case study of Wuhan, 1990-2013. Ecological Modelling, 318, 204-209(2015).
[2] Y Chi, W Zheng, H Shi H et al. Spatial heterogeneity of estuarine wetland ecosystem health influenced by complex natural and anthropogenic factors. Science of the Total Environment, 634, 1445-1462(2018).
[3] F Cuffney T, A Brightbill R, T May J et al. Responses of benthic macroinvertebrates to environmental changes associated with urbanization in nine metropolitan areas. Ecological Applications, 20, 1384-1401(2010).
[4] J Cui L, J Gao C, S Zhao X et al. Dynamics of the lakes in the middle and lower reaches of the Yangtze River Basin, China, since late nineteenth century. Environmental Monitoring and Assessment, 185, 4005-4018(2013).
[5] X Dai, S Yang G, R Wan R et al. The effect of the Changjiang River on water regimes of its tributary Lake East Dongting. Journal of Geographical Sciences, 28, 1072-1084(2018).
[6] X Dai, R Wan R, GS Yang. Non-stationary water-level fluctuation in China’s Poyang Lake and its interactions with Yangtze River. Journal of Geographical Sciences, 25, 274-288(2015).
[7] Y Deng, G Jiang W, H Tang Z et al. Spatio-temporal change of lake water extent in Wuhan urban agglomeration based on Landsat images from 1987 to 2015. Remote Sensing, 9, 270(2017).
[8] L Ding, L Chen K, G Cheng S et al. Water ecological carrying capacity of urban lakes in the context of rapid urbanization: A case study of East Lake in Wuhan. Physics and Chemistry of the Earth, Parts A/B/C, 89, 104-113(2015).
[9] R Du N, H Ottens, R Sliuzas. Spatial impact of urban expansion on surface water bodies: A case study of Wuhan, China. Landscape and Urban Planning, 94, 175-185(2010).
[10] F Han L, P Xu Y, L Yang et al. Temporal and spatial change of stream structure in Yangtze River Delta and its driving forces during 1960s-2010s. Acta Geographica Sinica, 70, 819-827(2015).
[11] D Huang W, J Liao J, Z Shen G. Lake change in past 40 years in the southern Nagqu District of Tibet and analysis of its driving forces. Remote Sensing for Land and Resources, 24, 122-128(2012).
[12] P Ji, D Guo H, L Zhang. Remote sensing study of glacier dynamic change in West Kunlun Mountains in the past 20 years. Remote Sensing for Land and Resources, 25, 93-98(2013).
[14] H Jiang Q, F Liu Y, J Huang P. The source-sink effect between urban diffuse pollution and Lake watershed: A case study in East Lake of Wuhan. Ecology and Environmental Sciences, 22, 469-474(2013).
[15] G Jiang W, Z Pan Y, P Hou et al. Assessment and analysis of wetland ecosystem health in Dongting Lake. Geographical Research, 28, 1665-1671(2009).
[16] G Jin, K Chen, P Wang et al. Trade-offs in land-use competition and sustainable land development in the North China Plain. Technological Forecasting and Social Change, 141, 36-46(2019).
[17] G Jin, Z Deng X, X Chu et al. Optimization of land-use management for ecosystem service improvement: A review. Physics and Chemistry of the Earth, Parts A/B/C, 101, 70-77(2017).
[18] G Jin, Z Deng X, D Zhao X et al. Spatiotemporal patterns in urbanization efficiency within the Yangtze River Economic Belt between 2005 and 2014. Journal of Geographical Sciences, 28, 1113-1126(2018).
[21] H Kong F, N Nakagoshi. Spatial-temporal gradient analysis of urban green spaces in Jinan, China. Landscape and Urban Planning, 78, 147-164(2006).
[22] D Li G, A Sun S, L Fang C. The varying driving forces of urban expansion in China: Insights from a spatial-temporal analysis. Landscape and Urban Planning, 174, 63-77(2018).
[23] B Li H, S Yu, L Li G et al. Spatial distribution and historical records of mercury sedimentation in urban lakes under urbanization impacts. Science of the Total Environment, 445, 117-125(2013).
[24] N Li, L Yang, W Deng X et al. Aquatic plant diversity in relation to lake morphology in the middle and lower reaches of the Yangtze River. Plant Science Journal, 36, 65-72(2018).
[25] C Li S, L Bing Z, G Jin. Spatially explicit mapping of soil conservation service in monetary units due to land use/cover change for the Three Gorges Reservoir Area, China. Remote Sensing, 11, 468(2019).
[26] M Malavasi, M Carboni, M Cutini et al. Landscape fragmentation, land-use legacy and propagule pressure promote plant invasion on coastal dunes: A patch-based approach. Landscape Ecology, 29, 1541-1550(2014).
[27] K McFeeters S. The use of the Normalized Difference Water Index (NDWI) in the delineation of open water features. International Journal of Remote Sensing, 17, 1425-1432(1996).
[28] Y Niu, W Jiao, H Yu et al. Spatial evaluation of heavy metals concentrations in the surface sediment of Taihu Lake. International Journal of Environmental Research and Public Health, 12, 15028-15039(2015).
[29] O Ouma Y, R Tateishi. A water index for rapid mapping of shoreline changes of five East African Rift Valley lakes: An empirical analysis using Landsat TM and ETM+ data. International Journal of Remote Sensing, 27, 3153-3181(2006).
[30] Z Pei L, P Yan D, X Zhang H et al. Research on evolution characteristics and causes of urban lakes in Wuhan from 1960s. Geology and Mineral Resources of South China, 34, 78-86(2018).
[31] A Peters J, J Cooper M, M Creque S et al. Historical changes and current status of crayfish diversity and distribution in the Laurentian Great Lakes. Journal of Great Lakes Research, 40, 35-46(2014).
[32] W Qian D, J Gong, J Gao Y. Spatial-temporal difference and landscape pattern evolution of desertification in the middle reaches of the Heihe River: A case study of Linze County in Gansu. Journal of Arid Land Resources and Environment, 29, 85-90(2015).
[33] M Sahana, Y Hong H, H Sajjad. Analyzing urban spatial patterns and trend of urban growth using urban sprawl matrix: A study on Kolkata urban agglomeration, India. Science of the Total Environment, 628/629, 1557-1566(2018).
[34] H Shaikh Y, M Phathan J, F Maqdoom et al. Application of fractal geometry to lakes. Archives of Physics Research, 1, 147-170(2010).
[35] W Tang Z, L Cheng J, Y Yue. Accumulations and risks of heavy metals in the sediments from 8 typical lakes in Wuhan, China. Journal of Lake Sciences, 21, 61-68(2009).
[36] L Tsai W, R McHale M, V Jennings et al. Relationships between characteristics of urban green land cover and mental health in U.S. metropolitan areas. International Journal of Environmental Research and Public Health, 15, 340(2018).
[37] L Wang, H Liu. Comprehensive evaluation of regional resources and environmental carrying capacity using a PS-DR-DP theoretical model. Journal of Geographical Sciences, 29, 363-376(2019).
[38] G Wang W. Thoughts on the urbanization transformation of Wuhan. Yangtze Tribune, 33-35(2009).
[39] L Wang X, M Ning L, J Yu. Changes of urban wetland landscape pattern and impacts of urbanization on wetland in Wuhan city. Chinese Geographical Science, 18, 47-53(2008).
[40] J Wu. An empirical study of Wuhan lakefront landscape change [D]. Wuhan: Huazhong University of Science and Technology(2010).
[43] K Xu, F Kong C, G Liu et al. Changes of urban wetlands in Wuhan, China, from 1987 to 2005. Progress in Physical Geography: Earth and Environment, 34, 207-220(2010).
[44] H Yang B, L Ke X. Analysis on urban lake change during rapid urbanization using a synergistic approach: A case study of Wuhan, China. Physics and Chemistry of the Earth, Parts A/B/C, 89, 127-135(2015).
[45] F Yang Z, W Tang Z, Y Shen Z et al. One-hundred-year sedimentary record of polycyclic aromatic hydrocarbons in urban lake sediments from Wuhan, Central China. Water, Air, and Soil Pollution, 217, 577-587(2011).
[46] B Ye G, Z Su W, X Sun X. Simulation of the built-up land expansion based on the Dyna-CLUE Model in Taihu Basin. Resources and Environment in the Yangtze Basin, 27, 725-734(2018).
[47] G Zeng, J Gao H, G Zhu. Analysis of wetlands evolution process between Tarim Basin and Junggar Basin in the past 32 years. Remote Sensing for Land and Resources, 25, 118-123(2013).
[51] L Zhong. The study on waterfront landscape of urban lake sceneries: Taking Wuhan East Lake as an example. Beijing: Central Academy of Fine Arts(2008).
[52] M Zhou, F Zhang, J Wang et al. Effect of landscape pattern scale in the Ebinur Lake watershed, Xinjiang. Arid Zone Research, 34, 1184-1195(2017).
[53] H Zou Z, W Dong J, A Menarguez M et al. Continued decrease of open surface water body area in Oklahoma during 1984-2015. Science of the Total Environment, 595, 451-460(2017).

Set citation alerts for the article
Please enter your email address
© Copyright 2018-2021 | Chinese Laser Press. All Rights Reserved 沪ICP备15018463号-20