
An-bing ZHENG, Hui-hua YANG, Xi-peng PAN, Li-hui YIN, Yan-chun FENG. Identifying Multi-Class Drugs by Using Near-Infrared Spectroscopy and Variational Auto-Encoding Modeling[J]. Spectroscopy and Spectral Analysis, 2020, 40(12): 3946
- Spectroscopy and Spectral Analysis
- Vol. 40, Issue 12, 3946 (2020)
Abstract
Keywords
Introduction
Even if the drugs are produced according to the same standard, the product qualities are different when they are manufactured by different manufacturers (brands), and prices also varied greatly. It is inevitable that there are sellers who sell low-cost drug products with fake well-known brand packaging at high prices in the market since the main and most of the components is equal or similar. This is particularly serious in generic drug sale cases.
In addition, with the expansion of online pharmacies, there is also a kind of false “genuine drugs” appearing in the market, that is, some manufacturers without drug patents or licenses, or qualifications for drug production and sales (such as smuggled imported drugs), produce or sell “genuine” drugs, and affix forged regular brand packaging to sell in the market for profit.
In the long run, these drugs which evade the drug regulatory and approval procedures are harmful to the interests of consumers and bring significant risks to the entire drug market. Therefore, classifying multiple varieties and manufacturers of drugs to identify the true source of drugs after collecting samples, is of great significance in drug supervision.
Near-infrared spectroscopy (NIR) has the advantages of low instrument cost, direct measurement, non-destructive testing and on-site detection, and is particularly suitable for rapid qualitative and quantitative analysis of drugs[
NIR analysis combined with chemo-metrics has a long history in identifying and classifying drugs, but only linear classifiers such as PLS-DA, SVM[
Variational Auto-encoding (VAE)[
Based on VAE and taking full advantage of it as both feature extractor and data generator, this paper constructs a NIR classification model for multi-product and multi-manufacturer drugs through a uniquely designed artificial neural network structure and loss function.
The experimental materials were 4 kinds of drugs (metformin hydrochloride tablets, chlorpromazine hydrochloride tablets, chlorphenamine maleate tablets, cefuroxime axetil tablets) produced by 29 manufacturers collected by China Institute for Food and Drug Control. NIR data were measured by Bruker Matrix F spectrometer. The wavelength range of the data was 4 000~11 995 cm-1, and the resolution was 4 cm-1.
Experimental samples information is shown in Table 1.
As we can be seen from Table 1, the total number of samples is large, reaching 1 721, but the number of samples between classes is not balanced. Some classes have a large number of samples, reaching 135, and some classes have smaller sizes, only 21. This is quite consistent with the real scenario of drug supervision. In the real case of identifying generic drugs or counterfeit drugs, there are often more negative samples representing real drugs, while fewer samples of generic drugs or counterfeit drugs as positive samples. Inner the same drug, in order to provide more details about the true source in the modeling stage, the number of categories and samples were also taken as large as possible.
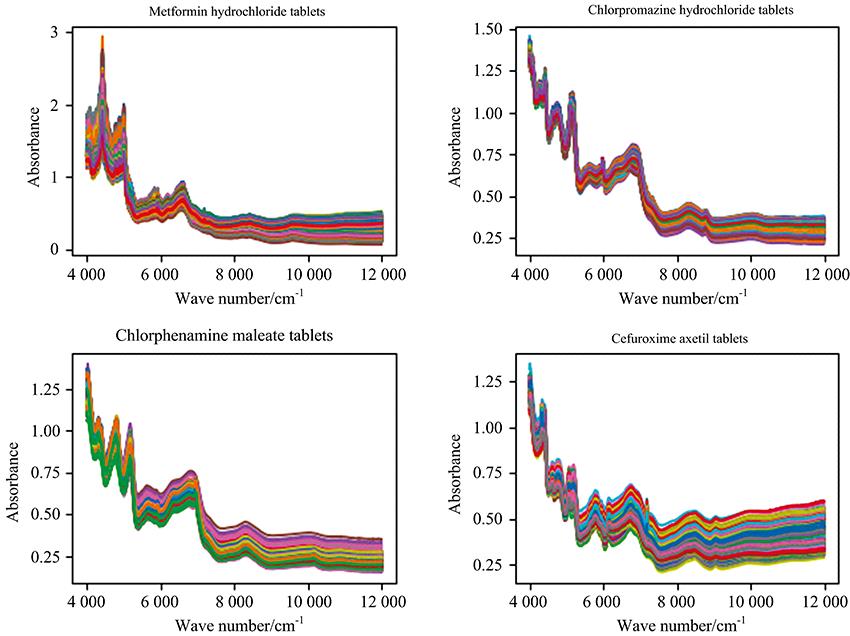
According to 4 drug names, the total spectra of 29 kinds of products produced by each manufacturer are shown in Fig.1.
![]()
Figure 1.Spectra of four kinds of drugs with a large number of samples, peak and valley positions overlap mostly
As we can see from Fig.1, the spectra of the same drug produced by different manufacturers according to the Pharmacopoeia of the People’s Republic of China (2020 version Ⅱ) are very similar, and the important bands (peak and valley positions) overlap mostly.
Taken metformin hydrochloride tablets manufactured by two manufacturers (No.6 and 7) and chlorphenamine maleate tablets manufactured by two manufacturers (No.18 and 19) from Fig.1. As shown in Fig.2, the difference between manufacturers of the spectra could hardly be seen by manual inspection.
![]()
Figure 2.Similar Spectra of the same drug produced by different manufactures. Metformin hydrochloride tablets came from No.6 and 7. Chlorphenamine maleate tablets came from No.18 and 19
Generally, the time from R&D to finalize the registration of the original drug took about 15 years, and it needs to undergo four phase clinical trials with a cost of hundreds of millions of dollars. Such drugs are not allowed to be imitated until the patent expires, and enjoy the protection of policies such as separate pricing. While generic drugs only replicate the components of the original drug, even if a huge investment is invested in the generic process, the price is only about 1/3 even 1/6 of the original drug. Therefore, it is understandable that generic drugs and the original drug can be as consistent as possible without being distinguished.
This poses a great challenge to classification algorithms and this paper will use the VAE algorithm to establish a multi-class classification model to achieve accurate classification of the above data.
The specific design block diagram of the model is shown in Fig.3. which includes three parts: encoder, decoder and classifier. Structurally, the design of the encoder and decoder is roughly the same as that of the general VAE, and the classifier is designed with MLP+softmax which also uses a common structure.
![]()
Figure 3.Overall structure block diagram
In Fig.3, the encoder is composed of MLP, and the input vector x is encoded into a family of implicit variable vectors z0 which grouped in pairs. Unlike traditional Auto-encoding, z0 here is not a dimension-reducing feature coding of x, although it is feed-forward from MLP. In a practical sense, z0 refers to the mean and variance pairs, which is required to randomly generate new vectors in the next step (re-parameter step).
In the re-parameter step, N (0, 1) is used to sample the normal distribution random value for each dimension, and then, using the means and variances in the previous step, the sample value can be adjusted to a set of normal distribution sampling values z1 (Z1, Z2, …, Zm).
Thereafter, z1 (Z1, Z2, …, Zm) is reconstructed into a spectral absorbance vector by MLP. VAE, on the one hand, wants the least loss of reconstruction, on the other hand, hopes the least difference between the two probabilities(x transforms to z1 and z1 reconstructs ), so its loss function was composited by two parts: reconstruction loss and KL loss.
Since the data involved in the calculation in this paper are spectral absorbance, which usually uses MSE to calculate reconstruction loss, we changed the original VAE reconstruction loss function form cross-entropy loss to MSE loss in this paper
(1)
A parameter k is also introduced as the dimension coefficient to be determined in this case. This is because MSE loss and KL loss are two different scales, one measures the 2-norm loss of absolute value and the other measures distribution difference. There is a great difference between them in numerical value (in fact, in the follow-up experiment of this paper, R is about 330 times of KL, setting k to 0.003 is appropriate), if not introduced k to adjust the sum of the loss, the whole network will be considered more in reconstruction loss and the distribution difference will be ignored, the whole network will be degraded into a sparse Auto-encoding network.
Since the Auto-encoder and the classification MLP are trained simultaneously in this paper and share the same Loss function, classification loss must be added to the total loss, which is a cross-entropy loss
(2)
Among them, another ratio parameter lambda is introduced in this paper, which redistributes the total loss between classifier and VAE, remains to be determined in the experiment.
The experimental data were divided into a training set and test set according to 9:1, 8:2, 7:3, 6:4, 5:5, 4:6, 3:7, 2:8. Each experiment was conducted 10 times. Because we should choose the best model finally to apply in practice, we recorded only the best results. The classification results are shown in Table 2.
From Table 2, it can be seen that our model has a classification accuracy of more than 99% when the proportion of training set is more than 50%, and the accuracy of each division is not very different, as if it has little relationship with the division of training set and test set. However, when the training set is only 40%, there is a big drop in accuracy, from 99% to around 90%. Since most of the categories in the dataset have the number of samples between 30 and 50, when the training set accounts for less than 40%, most of the categories begin to appear the shortage of insufficient data obviously. When the training set is only 30%, only 6 samples from the minimum category are trained, whereas to 20%, only 4 samples from the minimum category participate in the training course, and fewer than 10 samples from majority categories (15 of 29 categories) can be used for training.
The experimental results in this paper are compared with three kinds of algorithms: one against the traditional linear classification algorithms, mainly PLS-DA, linear SVM; the other against the traditional non-linear classification algorithms, mainly RBF SVM, k-NN, BP-ANN; the third against the deep learning algorithms in recent years, mainly DBN, SAE and CNN.
The comparison accuracy result is shown in table 3.
In Table 3, from the most precise value we can see that VAE classification accuracy performed the best. CNN, SAE, DBN and other deep learning algorithms followed, PLS-DA and linear SVM algorithms still have strong vitality, and the traditional non-linear classification algorithm also has some effect.
Except for PLS-DA, when the partitioning of the training set and test set is extremely bad, each algorithm will encounter an avalanche classification accuracy decline inflection point because of scarce of data. Among them, the non-linear algorithm is more sensitive in this situation than the linear algorithm.
VAE algorithm has average sensitivity in terms of data missing, but when the condition is serious, its precision declines more obviously. This is because VAE does its classification just according to its generated data rather than the original data. It acts just like a radical expert who judges only according to his own imagination. When his “experience” direction is correct, he has better judgment than others, even the situation is bad. Once the direction is wrong, he will be more likely to make mistakes than ordinary ones.
The training time and inferencing time of the algorithm are shown in Table 4.
As can be seen from the table, with the decrease in the proportion of training set, the training time shows a downward trend, while the inferencing time shows an upward trend. The k-NN algorithm has the least training time, but its accuracy is the worst. PLS-DA and CNN followed by. While VAE, BP-ANN and other deep learning algorithms have large training time overhead. In terms of inferencing, VAE is faster than traditional nonlinear classification algorithms (SVM and k-NN), but slower than other kinds of deep learning algorithms and BP-ANN.
The experimental results show that in the scenarios where the number of classes is large, the number of spectra to be analyzed is large, and the difference between sample classes is small, the classification effect of our model is significantly better than that of linear classifiers such as PLS-DA, SVM and deep learning classifiers such as SSAE and DBN. Compared with CNN classifier, although the performance is flat or slightly improved, the modeling design has less complexity, fewer hyper-parameters and easier to be utilized.
References
[1] Solanki Ragini, Prajapati Parixit, Modi Vishalkumar et al. IJPCA, 3, 117(2016).
[2] Xiaoli Chu. Molecular Spectroscopy Analytical Technology Combined With Chemometrics and Its Application, 95(2011).
[3] , Nian Yong, Wei Ni. Chinese Chemical Letters, 91(2011).
[4] Dongchen Huang, Tianming Yang, Haiyan Fu et al. Chinese Chemical Letters, 24, 639(2013).
[5] V Pleteneva T, V Shtyleva S, E Elizarova T. Pharmaceutical Chemistry Journal, 42, 432(2008).
[6] Danzhuo Mao, Yongjian Yang, Xinxin Weng. Computers and Applied Chemistry, 29, 995(2012).
[7] Liping Gong, Na Yang, Weijian Wang et al. Chinese Journal of Pharmaceutical Analysis, 31, 1571(2011).
[8] Y Rodionova O, V Titova A, S Balyklova K et al. Talanta, 205, 120150(2019).
[9] E Byvatov, U Fechner, J Sadowski et al. Journal of Chemical Information and Computer Sciences, 43, 1882(2003).
[10] W Wu, L Massart D et al. Chemometrics and Intelligent Laboratory Systems, 35, 127(1996).
[11] Weidong Zhang, Jinquan Hu, Lingqiao Li et al. Chinese Journal of Analytical Chemistry(2018).
[12] Huihua Yang, Xipeng Pan, Baichao Hu et al. Journal of Innovative Optical Health Sciences, S1793545816300111(2016).
[13] Xi-peng PAN, Ling-qiao LI, Yan-chun FENG et al. Sepctroscopy and Spectral Anlysis, 39, 3606(2019).
[14] M Welling, P Kingma D et al(2013).
[15] Oord A Van den, O Vinyals, A Razavi et al. Advances in Neural Information Processing Systems, 14837(2019).
[16] K Tanaka, K Morikawa, H Kameoka. 2018 IEEE International Conference on Acoustics, Speech and Signal Processing (ICASSP), 5779(2018).

Set citation alerts for the article
Please enter your email address
© Copyright 2018-2021 | Chinese Laser Press. All Rights Reserved 沪ICP备15018463号-20