
Ji Ping Zou, Hervé Coïc, Dimitris Papadopoulos. Spatiotemporal coupling investigations for Ti:sapphire-based multi-PW lasers[J]. High Power Laser Science and Engineering, 2022, 10(1): 010000e5
- High Power Laser Science and Engineering
- Vol. 10, Issue 1, 010000e5 (2022)
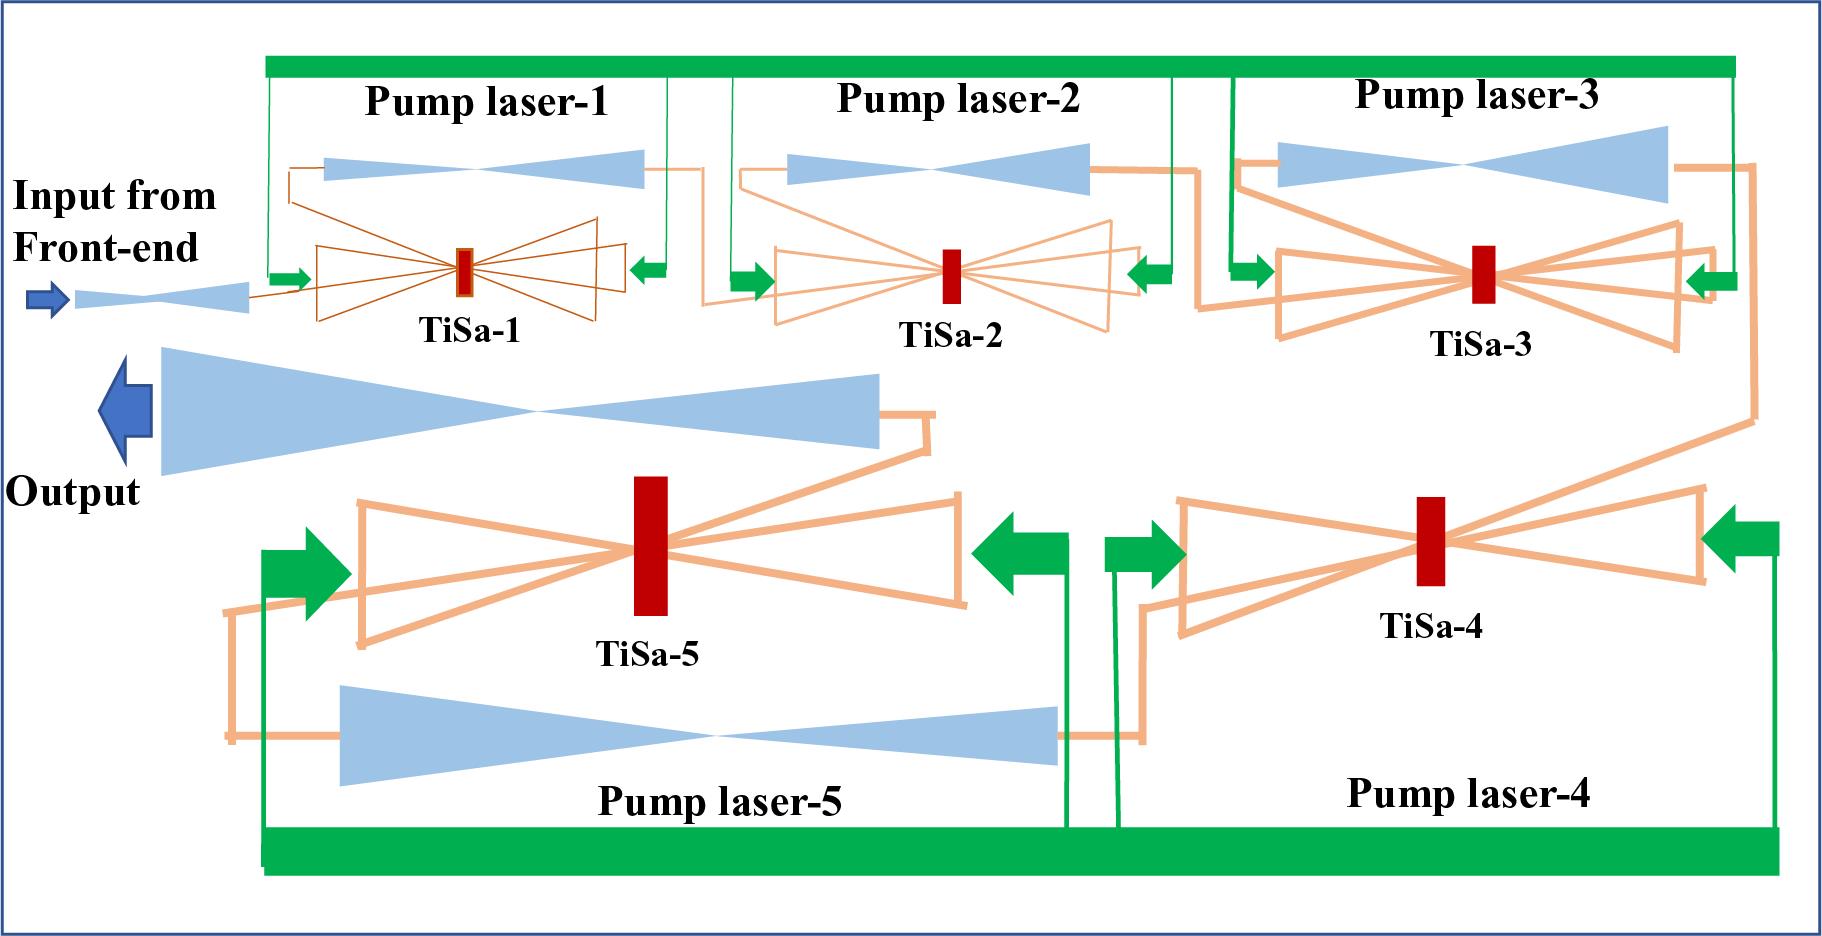
Fig. 1. Schematic of a Ti:sapphire-based multi-PW amplification chain.
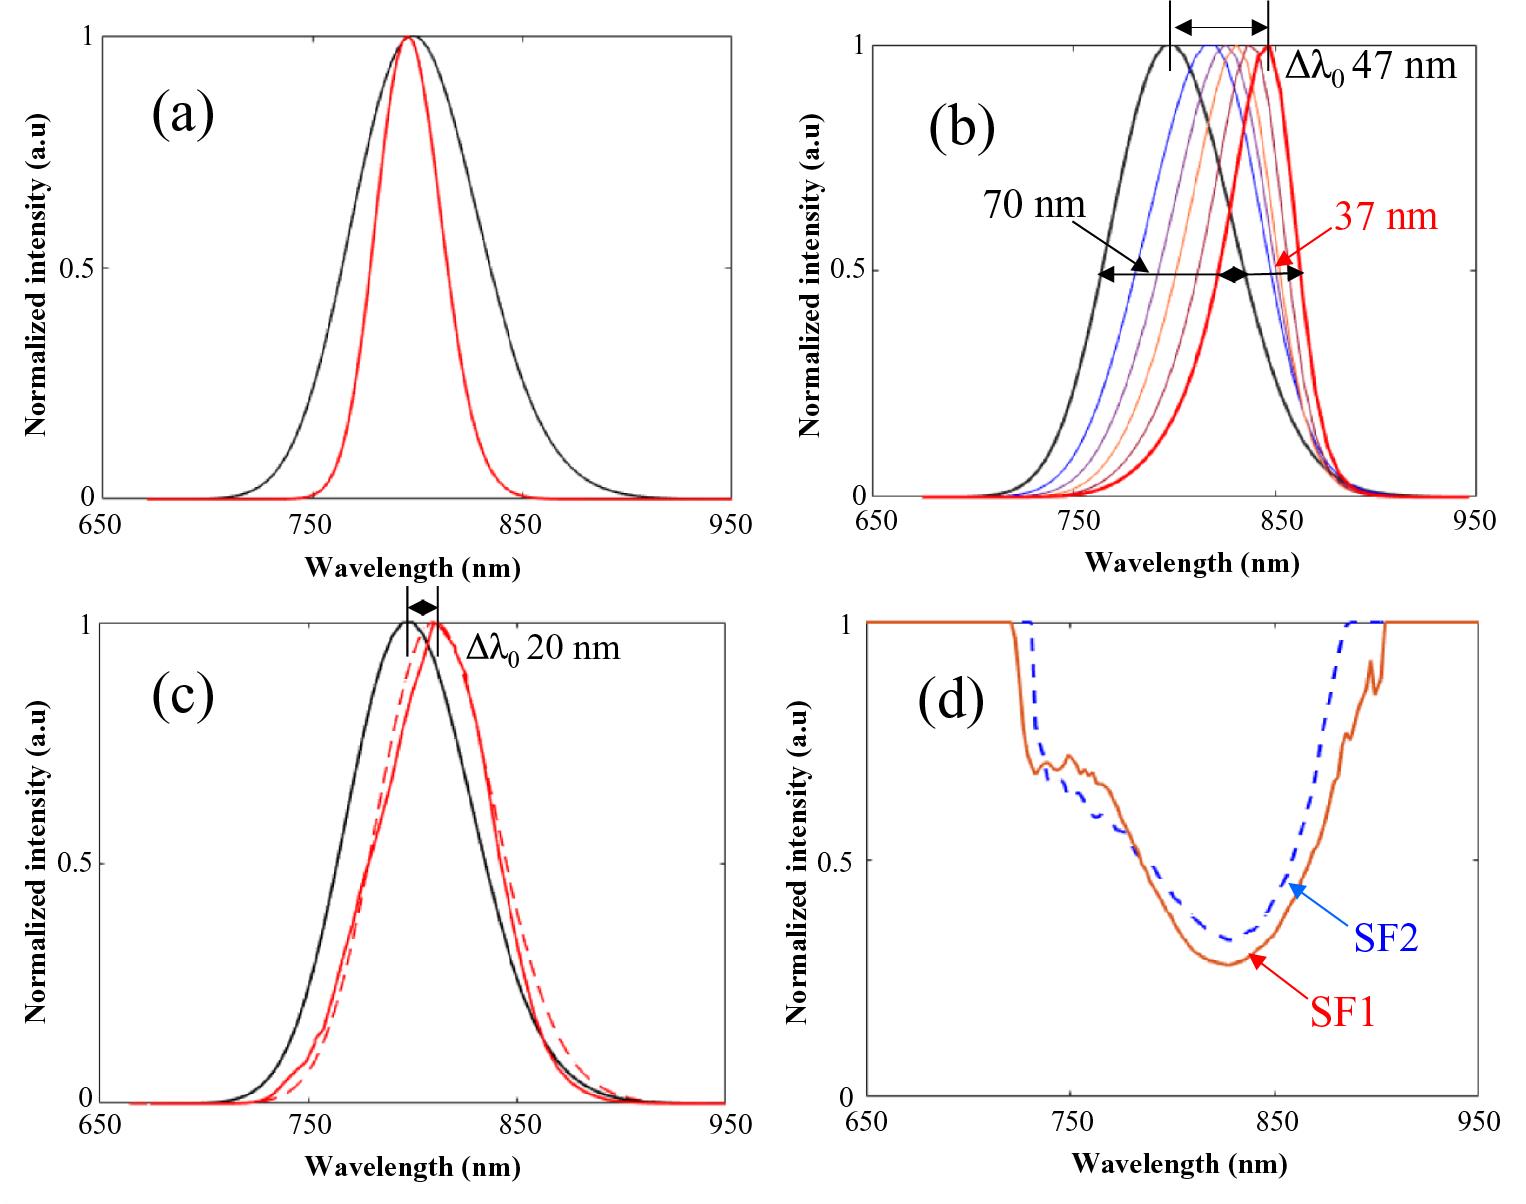
Fig. 2. Normalized input Gaussian spectrum (black line) and amplified spectrum (red line) with a total effective gain of 105: (a) without saturation effect; (b) under gain narrowing and gain saturation; (c) with gain narrowing and (d) with gain saturation compensation performed by two spectral filters, SF1 and SF2, set up in the chain.
Fig. 3. (a) Normalized experimental spectral input and spatially averaged spectral output, calculated for a 300 J, 14 cm ‘top-hat’ beam, amplified from a 5 mJ Gaussian beam. (b) Output beam spectrum radial evolution: eight output spectra from the beam center (red curve) and the edge of each circular sub-section.
Fig. 4. Normalized near-field intensity I (λ, x , (y = 0)) evolution along the chirped pulse amplification with the amplified energy from 5 mJ to 300 J and the beam diameter enlarged correspondingly from 2.5 to 140 mm.
Fig. 5. Series of normalized output fluence F (x , y = 0) with respect to the wavelength: whole spectrum and λ range from 740 to 900 nm with 40 nm intervals.
Fig. 6. Normalized encircled energy of the focus with (red curve) and without (blue curve) the analyzed spatiospectral gain inhomogeneity.
Fig. 7. (a) Compressed pulses and (b) induced spectral phases calculated after a double-pass compressor in three different cases: with a perfect grating alignment (black curve); with a default of grating parallelism Δθ = 0.01° (blue curve); and the default compensated by adjusting the compression distance (red curve). (c) Focal spot movement in x with respect to the wavelength. Laser caustic fluence of the focal spot in x –y , x –z and y –z planes: (d) with perfect incident beam and compressor alignment and (e) with the grating G2 misalignment (Δθ = 0.01°).
Fig. 8. (a) Measured residual spatial phases of the gratings G2 and G3 of the Apollon 10 PW compressor (ellipse: 900 mm long axis and 400 mm short axis). (b) Induced degradations in spatiotemporal Strehl ratio (blue curve) and in compressed pulse duration (orange curve). (c) Normalized encircled focal spot energy and (d) temporal contrast observed in the range of ±200 fs around the main pulse, when the spatial phase amplitude increases for all four gratings in the Apollon 10 PW compressor with the phase amplitude multiplying factor rising from 0 (red curves) to 8 (purple curves).
Fig. 9. (a) Normalized spectra in the beam center and two beam edges: spectral modulation is generated by the limited size of the grating G2 (Apollon 10 PW compressor). (b) Normalized peak power of the compressed pulse (in log) with and without spectral clipping. (c) Far-field S-T laser intensity observation around the focal spot (±600 μm in x ) and main pulse (±260 fs in time scale). (d) Main pulse and focal spot pedestal movement in time and in space.
Fig. 10. Focus caustic fluence in the x –z plane of a 14 cm beam: (a) in Gaussian distribution, without suffering any NL effect; (b) in Gaussian distribution, with B-integral of 1 rad; (c) in super-Gaussian beam distribution of the order of 10, with B-integral of 1 rad. (d) Apollon chain with output 300 J and B-integral of 1 rad. (e) NL focus z shift with respect to the wavelength under a B-integral of 1 rad and for a 14 cm beam: with as beam input Gaussian distribution (orange curve), super-Gaussian distribution of the order of 10 (blue curve) and the amplified Apollon beam described in Section 2 (black curve).
Fig. 11. (a) Measured spectral phases in P- and S-polarizations generated by MLD and MMLD mirror coatings. (b) Laser pulse peak power observed at the focus in log-scale: black, mirror coating without any spectral phase; red, mirror with MMLD coating; blue, mirror with MLD coating.

Set citation alerts for the article
Please enter your email address
© Copyright 2018-2021 | Chinese Laser Press. All Rights Reserved 沪ICP备15018463号-20