• Advanced Photonics
  • Vol. 4, Issue 5, 056001 (2022)
Jinhai Zou1、2, Jinfen Hong1、2, Zhuang Zhao3, Qingyuan Li1, Qiujun Ruan1, Hang Wang1, Yikun Bu1、*, Xianchao Guan3, Min Zhou3, Zhiyong Feng3, and Zhengqian Luo1、2、4、*
Author Affiliations
  • 1Xiamen University, School of Electronic Science and Engineering, Fujian Key Laboratory of Ultrafast Laser Technology and Applications, Xiamen, China
  • 2Innovation Laboratory for Sciences and Technologies of Energy Materials of Fujian Province (IKKEM), Xiamen, China
  • 3Huawei Technologies Co., Ltd., Shenzhen, China
  • 4Xiamen University, Shenzhen Research Institute, Shenzhen, China
  • show less
    DOI: 10.1117/1.AP.4.5.056001 Cite this Article Set citation alerts
    Jinhai Zou, Jinfen Hong, Zhuang Zhao, Qingyuan Li, Qiujun Ruan, Hang Wang, Yikun Bu, Xianchao Guan, Min Zhou, Zhiyong Feng, Zhengqian Luo. 3.6 W compact all-fiber Pr3+-doped green laser at 521 nm[J]. Advanced Photonics, 2022, 4(5): 056001 Copy Citation Text show less
    Spectroscopy of 8000 ppm DC Pr3+-doped fluoride fiber. (a) Absorption spectrum; inset: attenuation and propagation loss spectra. (b) Absorption cross section spectrum. (c) Simplified energy-level scheme of Pr3+. (d) Fluorescence spectrum excited by a 443-nm laser.
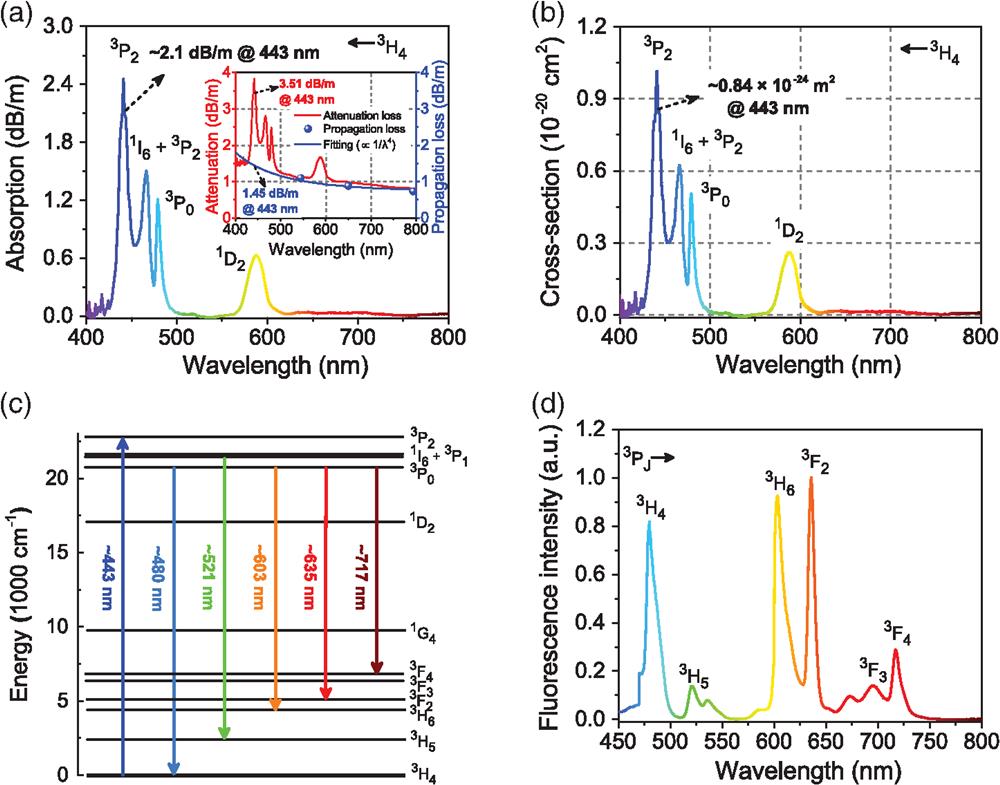
    Fig. 1. Spectroscopy of 8000 ppm DC Pr3+-doped fluoride fiber. (a) Absorption spectrum; inset: attenuation and propagation loss spectra. (b) Absorption cross section spectrum. (c) Simplified energy-level scheme of Pr3+. (d) Fluorescence spectrum excited by a 443-nm laser.
    Microscopic images of DC Pr3+-doped fluoride fiber end-facet. (a) Traditional polishing processing and (b) cutting processing.
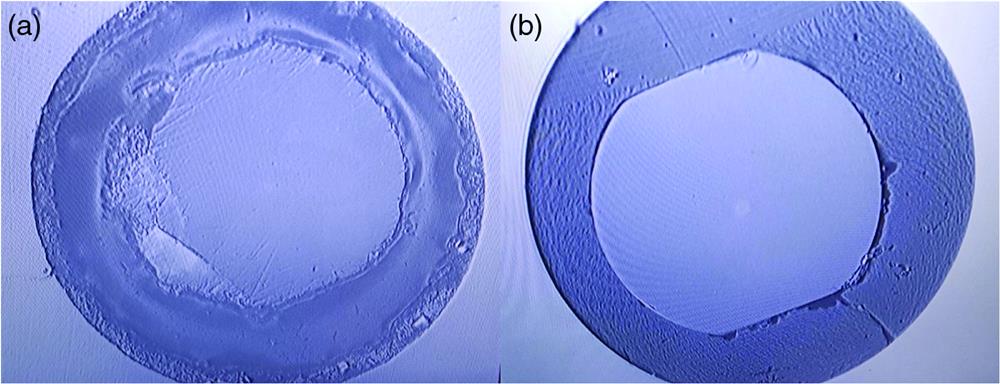
    Fig. 2. Microscopic images of DC Pr3+-doped fluoride fiber end-facet. (a) Traditional polishing processing and (b) cutting processing.
    (a) Schematic and (b) photograph of the compact all-fiber Pr3+-doped green laser (inset: green light laser spot). (c) The transmission spectra of FDMs (M1, M2); insets: photograph (upper) and microscopic image (lower) of the M1.
    Fig. 3. (a) Schematic and (b) photograph of the compact all-fiber Pr3+-doped green laser (inset: green light laser spot). (c) The transmission spectra of FDMs (M1, M2); insets: photograph (upper) and microscopic image (lower) of the M1.
    Characteristics of the high-power all-fiber green laser. (a) Output green power versus the pump power. (b) Typical spectrum collected from 400 to 800 nm under 5.71 W pump power. (c) Output spectra under different pump powers. (d) Power stability curve of the green laser operating at 3.0 W. Insets: the beam quality parameters and intensity distribution of the green laser.
    Fig. 4. Characteristics of the high-power all-fiber green laser. (a) Output green power versus the pump power. (b) Typical spectrum collected from 400 to 800 nm under 5.71 W pump power. (c) Output spectra under different pump powers. (d) Power stability curve of the green laser operating at 3.0 W. Insets: the beam quality parameters and intensity distribution of the green laser.
    Characteristics of the all-fiber green laser with different designs. (a) Output green power versus the pump power and (b) the corresponding spectra pumped at 3.76 W.
    Fig. 5. Characteristics of the all-fiber green laser with different designs. (a) Output green power versus the pump power and (b) the corresponding spectra pumped at 3.76 W.
    Numerical model. (a) Typical four-level system and (b) schematic of end-pumped fiber laser.
    Fig. 6. Numerical model. (a) Typical four-level system and (b) schematic of end-pumped fiber laser.
    Simulation performance of the all-fiber green laser. (a) Output power as a function of the L for different R2, and (b) the slope efficiency and laser threshold versus the L under R2=75%, R2p=95%. (c) Output power versus the R2 for different pump powers, and (d) the slope efficiency and laser threshold versus the R2 under L=2 m, R2p=95%.
    Fig. 7. Simulation performance of the all-fiber green laser. (a) Output power as a function of the L for different R2, and (b) the slope efficiency and laser threshold versus the L under R2=75%, R2p=95%. (c) Output power versus the R2 for different pump powers, and (d) the slope efficiency and laser threshold versus the R2 under L=2  m, R2p=95%.
    (a) Green output power as a function of the pump power for different L and R2. (b) Green output power versus the doping concentration of Pr3+ under L=2.0 m, R2p=95%.
    Fig. 8. (a) Green output power as a function of the pump power for different L and R2. (b) Green output power versus the doping concentration of Pr3+ under L=2.0  m, R2p=95%.
    ParameterValueParameterValue
    λp443 nmαp345.4×103  m1
    λs521 nmαs92.1×103  m1
    σap0.84×1024  m2Γp3.61×103
    σep0Γs0.92
    σas0LVariable
    σes0.32×1024  m2R1p4%
    τ40  μsR199%
    N1.55×1026  m3R2p95%
    Ac44.2×1012  m2R2Variable
    Table 1. The parameters used in numerical simulation.
    Jinhai Zou, Jinfen Hong, Zhuang Zhao, Qingyuan Li, Qiujun Ruan, Hang Wang, Yikun Bu, Xianchao Guan, Min Zhou, Zhiyong Feng, Zhengqian Luo. 3.6 W compact all-fiber Pr3+-doped green laser at 521 nm[J]. Advanced Photonics, 2022, 4(5): 056001
    Download Citation