• Journal of Geographical Sciences
  • Vol. 30, Issue 5, 757 (2020)
Shaojian WANG1、*, Shuang GAO1, Yongyuan HUANG2, and Chenyi SHI1
Author Affiliations
  • 1Guangdong Provincial Key Laboratory of Urbanization and Geo-simulation, School of Geography and Planning, Sun Yat-sen University, Guangzhou 510275, China
  • 2College of Urban and Environmental Sciences, Peking University, Beijing 100871, China
  • show less
    DOI: 10.1007/s11442-020-1754-3 Cite this Article
    Shaojian WANG, Shuang GAO, Yongyuan HUANG, Chenyi SHI. Spatiotemporal evolution of urban carbon emission performance in China and prediction of future trends[J]. Journal of Geographical Sciences, 2020, 30(5): 757 Copy Citation Text show less
    Effects of different factors on urban carbon emission performance from an input-output perspective
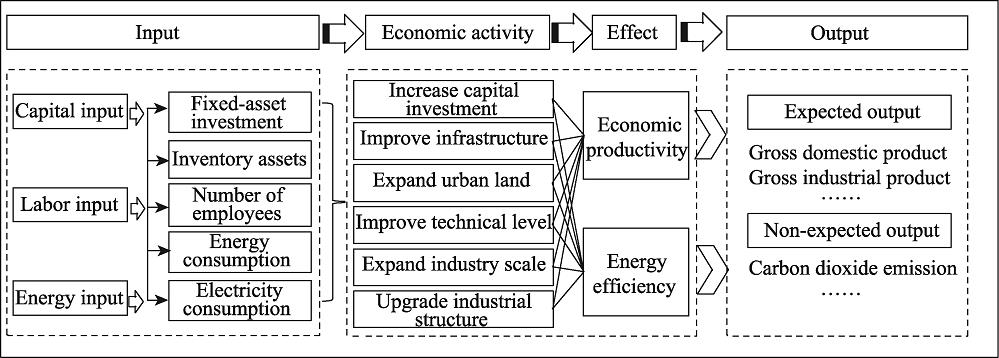
    Fig. 1. Effects of different factors on urban carbon emission performance from an input-output perspective
    Evolution in urban carbon emission performance from 1992-2013
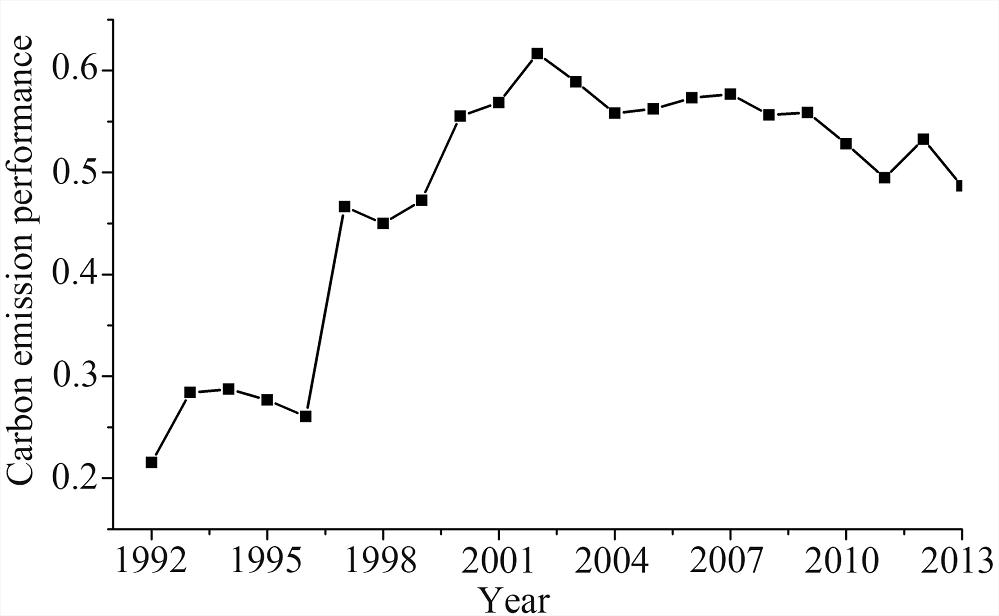
    Fig. 2. Evolution in urban carbon emission performance from 1992-2013
    Box plot of urban carbon emission performance in Chinese cities from 1992 to 2013
    Fig. 3. Box plot of urban carbon emission performance in Chinese cities from 1992 to 2013
    Spatial distributions of urban carbon emission performance in Chinese cities from 1992-2013
    Fig. 4. Spatial distributions of urban carbon emission performance in Chinese cities from 1992-2013
    IndicatorVariableUnitMeanMinMaxS.D.
    InputFixed-asset investment108 yuan42.6512.95836.2466.34
    Number of employees104 person220.360.321729.55169.70
    Electricity consumption104 kwh680.870.258514.69907.31
    Expected outputGDP108 yuan103.972.961483.55125.46
    Non-expected outputCO2 emissions104 t1665.890.6220832.942219.91
    Table 1.

    System of input-output indicators for carbon emission performance

    t/t+11234
    1P11P12P13P14
    2P21P22P23P24
    3P31P32P33P34
    4P41P42P43P44
    Table 2.

    Markov transfer probability matrix (k = 4)

    Lagt/t+11234
    11P11|1P12|1P13|1P14|1
    2P21|1P22|1P23|1P24|1
    3P31|1P32|1P33|1P34|1
    4P41|1P42|1P43|1P44|1
    21P11|2P12|2P13|2P14|2
    2P21|2P22|2P23|2P24|2
    3P31|2P32|2P33|2P34|2
    4P41|2P42|2P43|2P44|2
    31P11|3P12|3P13|3P14|3
    2P21|3P22|3P23|3P24|3
    3P31|3P32|3P33|3P34|3
    4P41|3P42|3P43|3P44|3
    41P11|4P12|4P13|4P14|4
    2P21|4P22|4P23|4P24|4
    3P31|4P32|4P33|4P34|4
    4P41|4P42|4P43|4P44|4
    Table 3.

    Spatial Markov transfer probability matrix (k = 4)

    t/t+1n1234
    115140.74370.17770.05750.0211
    214570.10300.66030.19290.0439
    314720.01770.17930.63720.1658
    415000.01330.02530.16000.8013
    Table 4.

    Markov matrix of city-level carbon emission performance types from 1992-2013

    Lagt/t+1n1234
    118070.77200.14370.05950.0248
    23130.15650.60060.18210.0607
    32060.03880.23300.56310.1650
    41760.03410.04550.13640.7841
    214700.73190.20000.05530.0128
    24360.11240.66510.17890.0436
    33210.02180.22740.59190.1589
    42560.04300.03130.19530.7305
    311820.69230.22530.04950.0330
    24400.07500.68410.20450.0364
    34750.01470.15370.65050.1811
    43710.00540.02960.20750.7574
    41550.60000.32730.07270.0000
    22680.07090.68280.20900.0373
    34700.00850.14890.68720.1553
    46970.00140.01580.12770.8551
    Table 5.

    Spatial Markov matrix of city-level carbon emission performance in China from 1992-2013

    State type1234
    Ignoring spatial lagInitial state0.14840.35340.30040.1979
    Ultimate state0.13770.25120.29480.3162
    Considering spatial lagUltimate state10.25210.25240.22420.2713
    20.19080.31840.27080.2201
    30.08510.25850.34710.3093
    40.04770.22200.32490.4054
    Table 6.

    Predicted evolution in carbon emission performance in Chinese cities

    Shaojian WANG, Shuang GAO, Yongyuan HUANG, Chenyi SHI. Spatiotemporal evolution of urban carbon emission performance in China and prediction of future trends[J]. Journal of Geographical Sciences, 2020, 30(5): 757
    Download Citation