• Chinese Optics Letters
  • Vol. 19, Issue 9, 091201 (2021)
Xianbin Wang1, Hongchang Deng2、*, and Libo Yuan2
Author Affiliations
  • 1Key Laboratory of In-fiber Integrated Optics, Ministry of Education, Harbin Engineering University, Harbin 150001, China
  • 2Photonics Research Center, School of Electronic Engineering and Automation, Guilin University of Electronic Technology, Guilin 541004, China
  • show less
    DOI: 10.3788/COL202119.091201 Cite this Article Set citation alerts
    Xianbin Wang, Hongchang Deng, Libo Yuan. High sensitivity cascaded helical-core fiber SPR sensors[J]. Chinese Optics Letters, 2021, 19(9): 091201 Copy Citation Text show less
    Cascaded HCF SPR sensor. (a) Working principle of SPR sensing. P1 and P2 are twisting pitches of Sensor I and Sensor II, respectively. The nearest distance between the core and side-polishing surface is about 4.5 µm. (b) Cross section of the HCF. The core offset Q is about 28 µm. (c) RI distribution of the HCF. The numerical aperture of the fiber is 0.08.
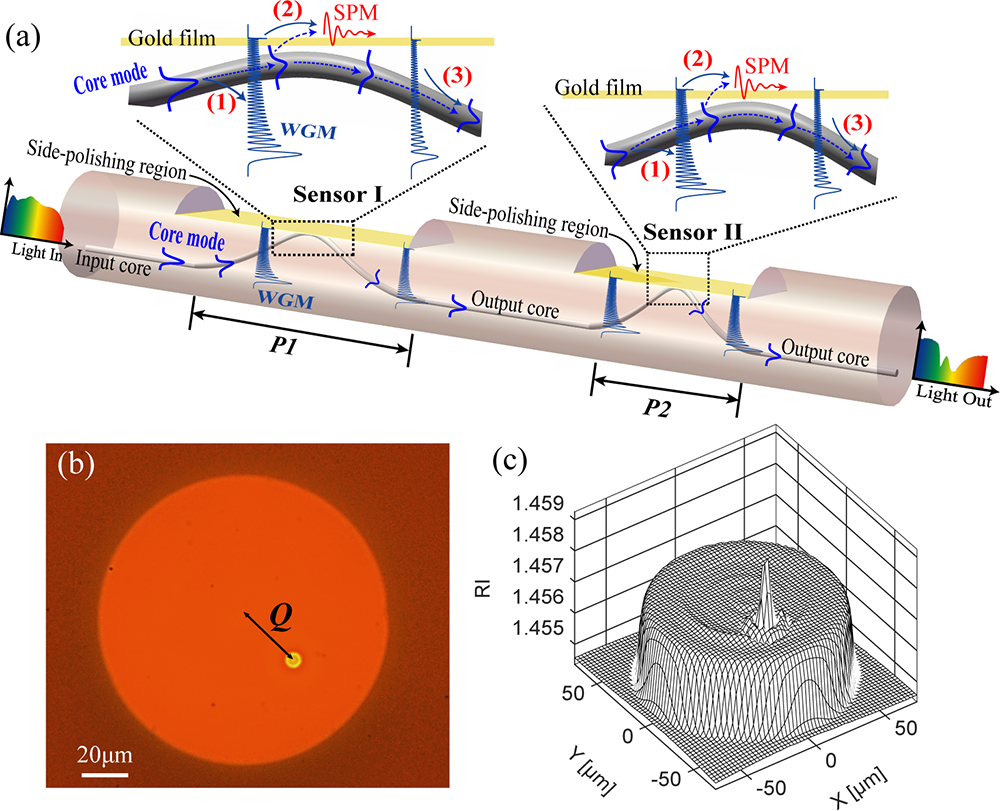
    Fig. 1. Cascaded HCF SPR sensor. (a) Working principle of SPR sensing. P1 and P2 are twisting pitches of Sensor I and Sensor II, respectively. The nearest distance between the core and side-polishing surface is about 4.5 µm. (b) Cross section of the HCF. The core offset Q is about 28 µm. (c) RI distribution of the HCF. The numerical aperture of the fiber is 0.08.
    Calculated results for the WGMs guided in the cladding of the HCF SPR sensors with different twist pitches from 1.4 mm to 5.0 mm. (a) Coupling efficiency between the output fundamental-core mode and n-order WGMs at the wavelength of 715 nm. The illustration corresponds to field distributions of the fundamental-core mode and SPM. (b) Normalized mode field distributions of the WGMs at the maximum coupling efficiency. (c) Dispersion curves for the WGMs (solid lines) and the SPMs (dash lines) for different analyte RIs ranging from 1.333 to 1.385.
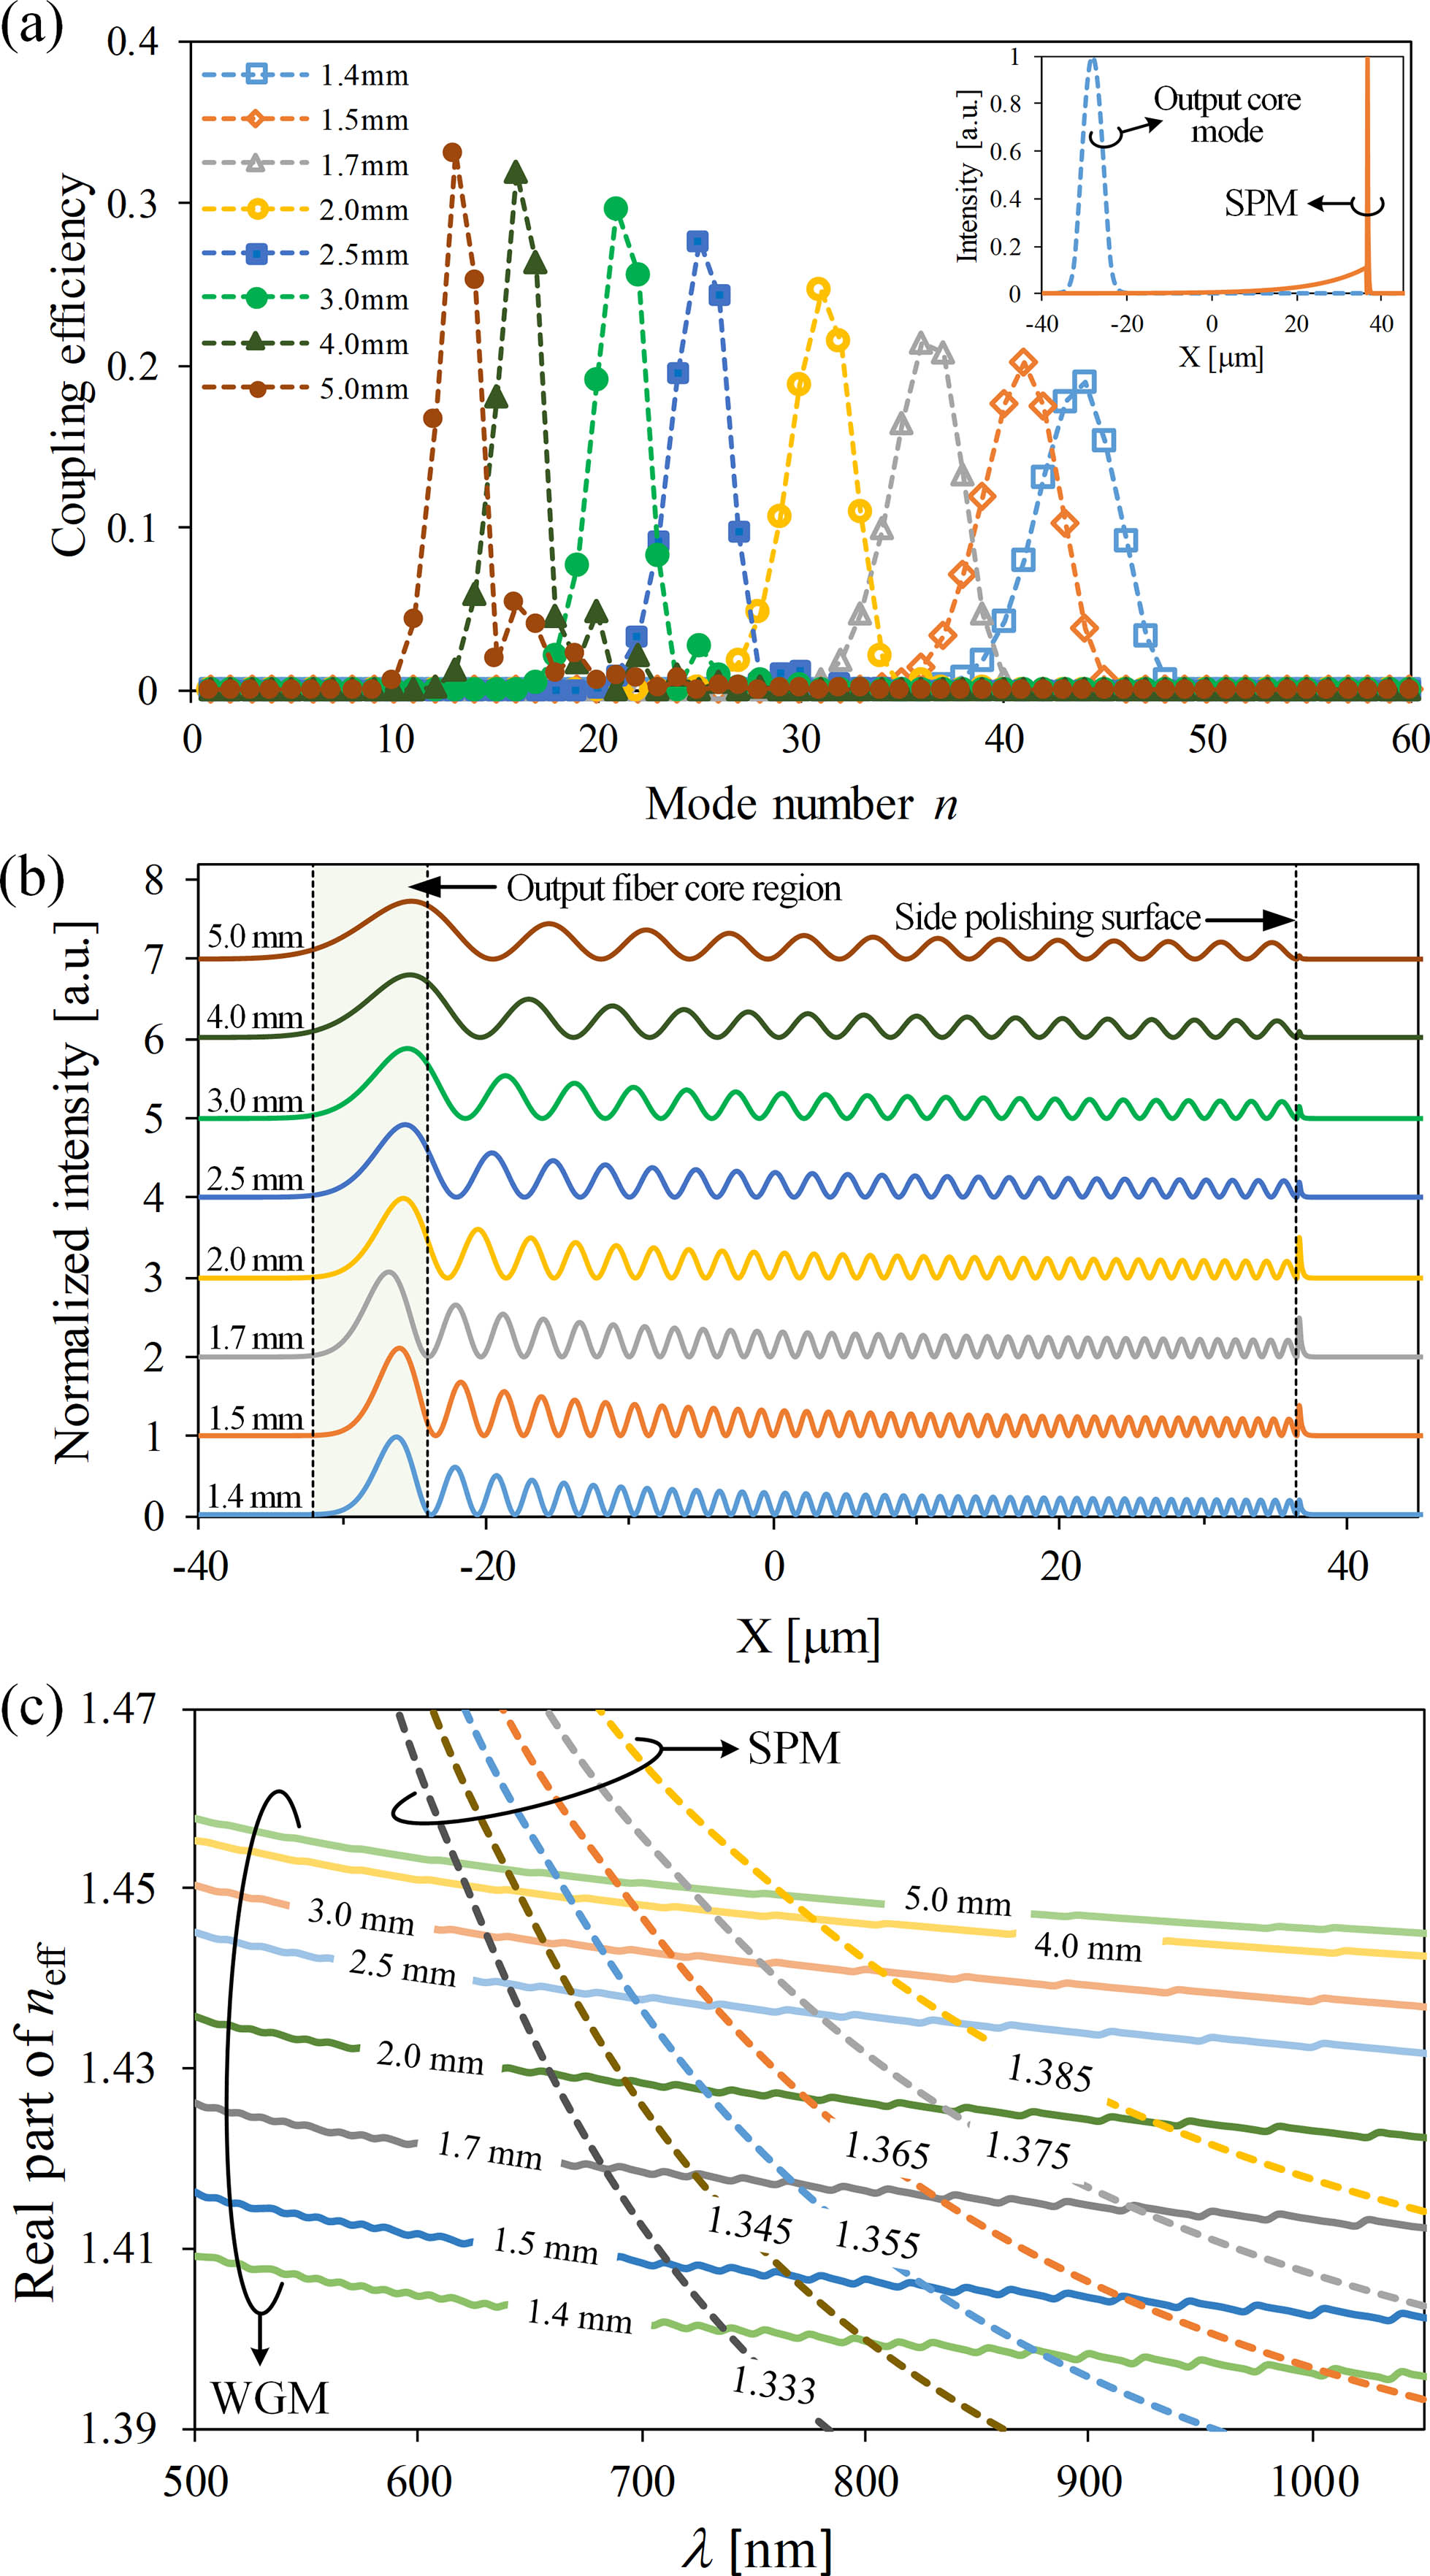
    Fig. 2. Calculated results for the WGMs guided in the cladding of the HCF SPR sensors with different twist pitches from 1.4 mm to 5.0 mm. (a) Coupling efficiency between the output fundamental-core mode and n-order WGMs at the wavelength of 715 nm. The illustration corresponds to field distributions of the fundamental-core mode and SPM. (b) Normalized mode field distributions of the WGMs at the maximum coupling efficiency. (c) Dispersion curves for the WGMs (solid lines) and the SPMs (dash lines) for different analyte RIs ranging from 1.333 to 1.385.
    Schematic of the proposed experimental setup of HCF SPR sensing. The inset shows a photograph of fusion splicing between the SMF and the ECF.
    Fig. 3. Schematic of the proposed experimental setup of HCF SPR sensing. The inset shows a photograph of fusion splicing between the SMF and the ECF.
    Normalized experimental spectra measured in samples with RIs varied from 1.333 to 1.385 for two cascaded HCF SPR sensors when one sensor is in air and the other sensor has different twist pitches. (a) P = 1.4 mm. (b) P = 2.0 mm. (c) P = 3.5 mm. (d)–(f) Corresponding calculation results of a single HCF SPR sensor. The arrow indicates the changing direction of the resonance depth.
    Fig. 4. Normalized experimental spectra measured in samples with RIs varied from 1.333 to 1.385 for two cascaded HCF SPR sensors when one sensor is in air and the other sensor has different twist pitches. (a) P = 1.4 mm. (b) P = 2.0 mm. (c) P = 3.5 mm. (d)–(f) Corresponding calculation results of a single HCF SPR sensor. The arrow indicates the changing direction of the resonance depth.
    Normalized experimental spectra of two cascaded HCF SPR sensors with different twist pitches (P) when the sample RI of one sensor is adjustable and the sample RI of the other sensor is fixed. (a) and (b) Sensor I with P = 3.5 mm, Sensor II with P = 2.0 mm. (c) and (d) Sensor I with P = 4.0 mm, Sensor II with P = 1.5 mm. (e) and (f) Sensor I with P = 4.5 mm, Sensor II with P = 1.4 mm.
    Fig. 5. Normalized experimental spectra of two cascaded HCF SPR sensors with different twist pitches (P) when the sample RI of one sensor is adjustable and the sample RI of the other sensor is fixed. (a) and (b) Sensor I with P = 3.5 mm, Sensor II with P = 2.0 mm. (c) and (d) Sensor I with P = 4.0 mm, Sensor II with P = 1.5 mm. (e) and (f) Sensor I with P = 4.5 mm, Sensor II with P = 1.4 mm.
    Normalized experimental spectra of cascaded HCF SPR sensors with different twist pitches (P) when Sensor I and Sensor II are in the same sample. (a) Sensor I with P = 3.5 mm, Sensor II with P = 2.0 mm. (b) Sensor I with P = 4.0 mm, Sensor II with P = 1.5 mm.
    Fig. 6. Normalized experimental spectra of cascaded HCF SPR sensors with different twist pitches (P) when Sensor I and Sensor II are in the same sample. (a) Sensor I with P = 3.5 mm, Sensor II with P = 2.0 mm. (b) Sensor I with P = 4.0 mm, Sensor II with P = 1.5 mm.
    Sensing characteristics of the cascaded HCF SPR sensor. (a) The resonant wavelength shifts with the twist pitch in different RIs of surrounding samples from 1.333 to 1.385. (b) Average sensitivity curves changing with a twist pitch in low and high RI measurements. Note that the low RI ranges from 1.333 to 1.355, and the high RI ranges from 1.355 to 1.365.
    Fig. 7. Sensing characteristics of the cascaded HCF SPR sensor. (a) The resonant wavelength shifts with the twist pitch in different RIs of surrounding samples from 1.333 to 1.385. (b) Average sensitivity curves changing with a twist pitch in low and high RI measurements. Note that the low RI ranges from 1.333 to 1.355, and the high RI ranges from 1.355 to 1.365.
    Xianbin Wang, Hongchang Deng, Libo Yuan. High sensitivity cascaded helical-core fiber SPR sensors[J]. Chinese Optics Letters, 2021, 19(9): 091201
    Download Citation