
Xianbin Wang, Hongchang Deng, Libo Yuan. High sensitivity cascaded helical-core fiber SPR sensors[J]. Chinese Optics Letters, 2021, 19(9): 091201
- Chinese Optics Letters
- Vol. 19, Issue 9, 091201 (2021)
Abstract
Keywords
1. Introduction
A surface plasmon resonance (SPR) sensor refers to the optic excitation of a surface plasmon wave at the interface between negative and positive permittivity material in bulk-optic and fiber-optic sensing systems[
In recent years, distributed fiber-optic SPR sensors attract much more attention in the measurement of complex samples[
Bending fiber SPR sensors also can realize resonant wavelengths and sensitivity modulation[
Sign up for Chinese Optics Letters TOC. Get the latest issue of Chinese Optics Letters delivered right to you!Sign up now
2. Sensor Principle
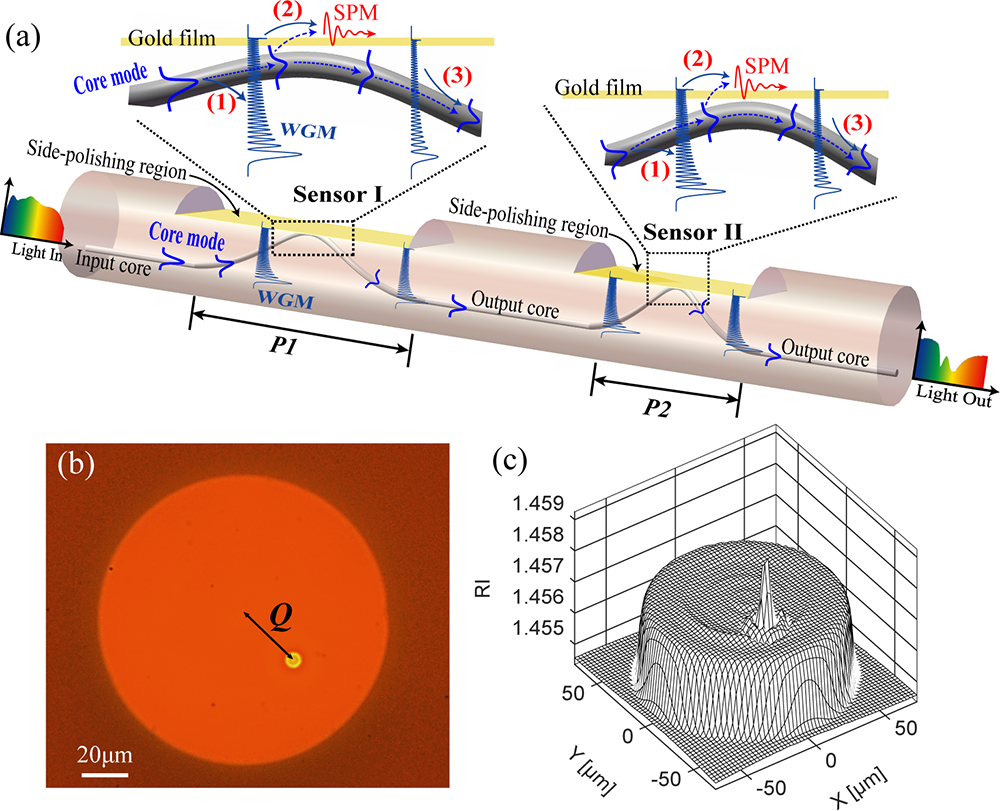
Figure 1(a) shows the schematic of the cascaded HCF SPR sensor, including Sensor I and Sensor II. Every single HCF SPR sensor is made by a side-polishing HCF coated with a gold film with a thickness of 50 nm. The HCF has only one helical period and is formed by twisting an eccentric-core fiber (ECF), as shown in Figs. 1(b) and 1(c). The coating length of the side-polishing area is approximately equal to the twist pitch of the HCF. The cascaded HCF SPR sensor can be separated into two single HCF SPR sensors. Therefore, for simplicity, we focus on the SPR excitation in a single HCF SPR sensor, and its working principle can be divided into three steps.
![]()
Figure 1.Cascaded HCF SPR sensor. (a) Working principle of SPR sensing. P1 and P2 are twisting pitches of Sensor I and Sensor II, respectively. The nearest distance between the core and side-polishing surface is about 4.5 µm. (b) Cross section of the HCF. The core offset Q is about 28 µm. (c) RI distribution of the HCF. The numerical aperture of the fiber is 0.08.
Firstly, a white light is incident into the input core of the straight ECF, thus generating a guided-core mode. When the core mode propagates along the helical core, the light will leak out of the helical core and form cladding WGMs. Second, the propagation field of the cladding WGMs can easily reach the side-polishing area. Therefore, when propagation constants of WGMs and the surface plasmon mode (SPM) are equal or close to each other, the evanescent wave of the cladding WGMs can excite the SPR at the boundary between the gold layer and surrounding medium. On the other hand, unless the helical core is close enough to the side-polishing area, the core mode guided by the helical core is difficult to excite SPR. Therefore, for the core mode, the ability to excite SPR is very weak. Third, after coupling among the core mode, cladding WGMs, and SPMs in the helical-core region, part of the cladding WGMs can be coupled into the output core of the straight ECF to form a guiding-core mode. Two cascaded sensors have a different twist pitch, which leads to different WGMs excitation conditions. Therefore, we can effectively control the SPR resonance effect by twisting an ECF instead of bending an optical fiber. The resonant wavelength of two cascaded sensors can be separated by adjusting the twist pitch difference between the two cascaded sensors.
Using the mode expansion and propagation (MEP) method and WGMs excited by the radiation light emitted by the helical core[
![]()
Figure 2.Calculated results for the WGMs guided in the cladding of the HCF SPR sensors with different twist pitches from 1.4 mm to 5.0 mm. (a) Coupling efficiency between the output fundamental-core mode and n-order WGMs at the wavelength of 715 nm. The illustration corresponds to field distributions of the fundamental-core mode and SPM. (b) Normalized mode field distributions of the WGMs at the maximum coupling efficiency. (c) Dispersion curves for the WGMs (solid lines) and the SPMs (dash lines) for different analyte RIs ranging from 1.333 to 1.385.
3. Experimental Methods
The sensing experimental setup is shown in Fig. 3. The two cascaded HCF SPR sensors were encapsulated in two separate micro-fluid chambers, respectively. As shown in the inset of Fig. 3, by monitoring the output power, the input and output ends of the ECF are spliced to an SMF through core alignment by using a common manual mode fiber splicer. The spectrum range of the input light of the supercontinuum source (SuperK compact, from NKT Photonics) is from 450 nm to 2400 nm. The output spectrum was monitored by a spectrum analyzer (AQ6373, from Yokokawa). In the sensing process, the different analyte samples were injected into the two separate micro-fluid chambers by two injection pumps connected to the inlet ends, respectively. After flowing through the sensing area of the HCF SPR sensor, the analyte was finally collected by a waste container connected to the outlet end. In our case, the RI of all of the analyte samples was measured using an Abbé refractometer (GDA-2S, from Gold), and the temperature of the sensor was maintained to be better than 0.1°C by a temperature control device.
![]()
Figure 3.Schematic of the proposed experimental setup of HCF SPR sensing. The inset shows a photograph of fusion splicing between the SMF and the ECF.
4. Results and Discussion
To analyze sensing characteristics of one single HCF SPR sensor, one of the two cascaded HCF SPR sensors is made active, while another one is put into the air, which is inactive for RI sensing. Figures 4(a)–4(c) show the experiment results of RI sensing of the active HCF SPR sensors with different twist pitches. We also calculate the normalized transmission spectra of the -polarized multiple WGMs propagating in the cladding of the HCF SPR sensing region using the transfer matrix method[
![]()
Figure 4.Normalized experimental spectra measured in samples with RIs varied from 1.333 to 1.385 for two cascaded HCF SPR sensors when one sensor is in air and the other sensor has different twist pitches. (a) P = 1.4 mm. (b) P = 2.0 mm. (c) P = 3.5 mm. (d)–(f) Corresponding calculation results of a single HCF SPR sensor. The arrow indicates the changing direction of the resonance depth.
By comparing Figs. 4(a)–4(c) and 4(d)–4(f), except for the resonance depth, the theoretical calculation results are in good agreement with the experimental results. The reason is that, in practical terms, optical fiber twisting will lead to optical loss, especially when the twist pitch becomes smaller. As seen from Figs. 4(a)–4(c), it can be clearly observed that the resonance depth decreases rapidly for a small twist pitch, but decreases very slowly for a long twist pitch. Due to the limitation of the theoretical model of the equivalent two-dimensional (2D) bending waveguide[
In our case, for the two cascaded HCF SPR sensors, the twist pitch of the first sensor (Sensor I) is greater than or equal to 3.5 mm, and the twist pitch of the second sensor (Sensor II) is less than or equal to 2.0 mm. When both sensors are active, different from the single activated sensor [see Figs. 4(a)–4(c)], the twist pitch difference of the two sensors leads to SPR spectrum separation to generate two dips, as shown in Figs. 5(a)–5(f). The two sensors also have the same sensing characteristics. The resonance wavelength at the SPR dip increases with increase of the RI of the analyte or decrease of the twist pitch of the HCF. However, two small twist pitch differences, such as less than or equal to 1.5 mm, might lead to a reduction in separation between the two SPR resonance dips and cause a merger of the SPR spectra, as shown in Figs. 5(a), 5(b), and 6(a). For a great twist pitch difference, such as greater than 2.0 mm, two well-separated and distinct SPR spectra are obtained, as shown in Figs. 5(c)–5(f) and 6(b). Therefore, the sensing measurement range is limited by the twist pitch difference between the two cascaded HCF SPR sensors or the measurement of RIs. For example, for two cascaded HCF SPR sensors with a twist pitch difference of 1.5 mm, the SPR spectra of the two sensors completely overlap in the same analyte sensing, as shown in Fig. 6(a). When the RI of the sensing analyte of Sensor I is less than or equal to 1.333, the minimum RI measured by Sensor II should be greater than 1.345, as shown in Fig. 5(a). On the other hand, the maximum value of the RI sensed by Sensor I may be less than 1.365 when the RI of the analyte for Sensor II is greater than or equal to 1.365, as shown in Fig. 5(b).
![]()
Figure 5.Normalized experimental spectra of two cascaded HCF SPR sensors with different twist pitches (P) when the sample RI of one sensor is adjustable and the sample RI of the other sensor is fixed. (a) and (b) Sensor I with P = 3.5 mm, Sensor II with P = 2.0 mm. (c) and (d) Sensor I with P = 4.0 mm, Sensor II with P = 1.5 mm. (e) and (f) Sensor I with P = 4.5 mm, Sensor II with P = 1.4 mm.
![]()
Figure 6.Normalized experimental spectra of cascaded HCF SPR sensors with different twist pitches (P) when Sensor I and Sensor II are in the same sample. (a) Sensor I with P = 3.5 mm, Sensor II with P = 2.0 mm. (b) Sensor I with P = 4.0 mm, Sensor II with P = 1.5 mm.
As mentioned above, with the increasing of the RI of the analyte or decreasing of the twist pitch of the HCF, the bending loss induced by optical fiber twisting results in reduction in resonance depth and spectral broadening. Therefore, the measurement limit is affected by the decrease of twist pitch. In Figs. 5(c) and 5(e), we can find that the maximum value of the RI measured by Sensor II at 1.5 mm and 1.4 mm twist pitches may be less than 1.375 and 1.365, respectively. However, with an increasing twist pitch, it can enlarge the measurement range but decrease the sensitivity. From Figs. 5(b), 5(d), and 5(f), we can clearly see that the resonant depth of Sensor I with a twist pitch of greater than 3 mm has little change in the RI measurement from 1.333 to 1.385. At the same time, movement of the resonance dip reduces compared with Sensor II.
Figures 7(a) and 7(b) show experimental and theoretical results of resonant wavelength and average sensitivity of cascaded HCF SPR sensors changing with the twist pitch in RI measurements, respectively. The calculated results agree very well with experiment results, which provide a theoretical basis for analyzing HCF SPR sensors by using WGMs. Both the resonant wavelength and average sensitivity decrease rapidly with the increase of twist pitch, which exhibits an exponential decay function relationship. In our case, the maximum and minimum values of average sensitivity are 11,180 nm/RIU and 5160 nm/RIU in a high RI measured by Sensor II with twist pitches of 1.5 mm and 2.0 mm, respectively. The sensitivity of Sensor II can be further improved by decreasing the twist pitch of the sensor. For example, the sensitivity of the sensor with a twist pitch of 1.4 mm can be over 20,000 nm/RIU theoretically. Compared with Sensor II, the twist pitch of Sensor I is longer, which leads to the decrease of its average sensitivity ranging from 2110 nm/RIU to 3360 nm/RIU. In distributed RI measurements, as mentioned above, Sensor II has high sensitivity, but its RI measurement range is limited. On the contrary, the sensitivity of Sensor I is lower, but the measuring range is wider. In addition, the sensitivity in high RI measurement is always higher than that in low RI measurement, as shown in Fig. 7(b).
![]()
Figure 7.Sensing characteristics of the cascaded HCF SPR sensor. (a) The resonant wavelength shifts with the twist pitch in different RIs of surrounding samples from 1.333 to 1.385. (b) Average sensitivity curves changing with a twist pitch in low and high RI measurements. Note that the low RI ranges from 1.333 to 1.355, and the high RI ranges from 1.355 to 1.365.
5. Conclusions
In summary, a cascaded SPR sensor based on a side-polishing HCF for the RI measurement is proposed and demonstrated theoretically and experimentally. The sensor consists of two cascaded HCF SPR sensors, whose resonant wavelength and sensitivity can be modulated effectively by adjusting the twist pitch of the HCF. The sensor can be used to achieve distributed RI measurements, but note that one should choose an appropriate twist pitch difference between two cascaded HCF SPR sensors to avoid a merger of the SPR spectra. The experiment results show that the theoretical method based on WGMs can analyze resonant wavelength changes accurately. The experimental sensitivity of the sensor with twist pitch of 1.5 mm can reach up to 11,180 nm/RIU for RI measurements ranging from 1.355 to 1.365. It is worth noting that the sensitivity can be further improved by decreasing the twist pitch, such as over 20,000 nm/RIU for a sensor with a twist pitch of 1.4 mm theoretically. The sensor can be integrated in sensing networks or a micro-fluidic chip, used for multi-parameter or distributed measurement, and may also be widely used in biological and chemical sensing applications.
References
[1] L. C. Oliveira, A. M. N. Lima, C. Thirstrup, H. F. Neff. Surface Plasmon Resonance Sensors: A Materials Guide to Design, Characterization, Optimization, and Usage(2019).
[2] R. B. Schasfoort. Handbook of Surface Plasmon Resonance(2017).
[3] E. Kretschmann, H. Raether. Notizen: radiative decay of non radiative surface plasmons excited by light. Zeitschrift für Naturforschung A, 23, 2135(1968).
[4] B. D. Gupta, R. Kant. Recent advances in surface plasmon resonance based fiber optic chemical and biosensors utilizing bulk and nanostructures. Opt. Laser Technol., 101, 144(2018).
[5] P. Jia, Z. Yang, J. Yang, H. Ebendorff-Heidepriem. Quasiperiodic nanohole arrays on optical fibers as plasmonic sensors: fabrication and sensitivity determination. ACS Sens., 1, 1078(2016).
[6] S. Qian, M. Lin, W. Ji, H. Yuan, Y. Zhang, Z. Jing, J. Zhao, J.-F. Masson, W. Peng. Boronic acid functionalized Au nanoparticles for selective microRNA signal amplification in fiber-optic surface plasmon resonance sensing system. ACS Sens., 3, 929(2018).
[7] F. Chiavaioli, P. Zubiate, I. Del Villar, C. R. Zamarreño, A. Giannetti, S. Tombelli, C. Trono, F. J. Arregui, I. R. Matias, F. Baldini. Femtomolar detection by nanocoated fiber label-free biosensors. ACS Sens., 3, 936(2018).
[8] D. Gong, Y. Yuan, L. Liang, M. Yang. Theoretical study on negative permittivity of the material producing sharp surface plasmon resonance dips. Chin. Opt. Lett., 17, 042801(2019).
[9] J.-H. Qu, A. Dillen, W. Saeys, J. Lammertyn, D. Spasic. Advancements in SPR biosensing technology: an overview of recent trends in smart layers design, multiplexing concepts, continuous monitoring and in vivo sensing. Anal. Chim. Acta, 1104, 10(2020).
[10] Y. Zhao, Q.-L. Wu, Y.-N. Zhang. Simultaneous measurement of salinity, temperature and pressure in seawater using optical fiber SPR sensor. Measurement, 148, 106792(2019).
[11] M. del Carmen Alonso-Murias, J. S. Vel, D. Monzon-Hernandez. SPR fiber tip sensor for the simultaneous measurement of refractive index, temperature, and level of a liquid. J. Lightwave Technol., 37, 4808(2019).
[12] Y. Moreno, Q. Song, Z. Xing, Y. Sun, Z. Yan. Hybrid tilted fiber gratings-based surface plasmon resonance sensor and its application for hemoglobin detection. Chin. Opt. Lett., 18, 100601(2020).
[13] Y. Zhang, P. Liang, Y. Wang, Y. Zhang, Z. Liu, Y. Wei, Z. Zhu, E. Zhao, J. Yang, L. Yuan. Cascaded distributed multichannel fiber SPR sensor based on gold film thickness adjustment approach. Sens. Actuat. A: Phys., 267, 526(2017).
[14] Y. Yuan, L. Wang, J. Huang. Theoretical investigation for two cascaded SPR fiber optic sensors. Sens. Actuat. B: Chem., 161, 269(2012).
[15] Z. Liu, Y. Wei, Y. Zhang, Y. Wang, E. Zhao, Y. Zhang, J. Yang, C. Liu, L. Yuan. A multi-channel fiber SPR sensor based on TDM technology. Sens. Actuat. B: Chem., 226, 326(2016).
[16] L. Liu, Z. Liu, Y. Zhang, S. Liu. V-shaped micro-structure optical fiber surface plasmon resonance sensor for the simultaneous measurement of the refractive index and temperature. Opt. Lett., 44, 5093(2019).
[17] Y. Wei, Y. Su, C. Liu, Y. Zhang, X. Nie, Z. Liu, Y. Zhang, F. Peng. Segmented detection SPR sensor based on seven-core fiber. Opt. Express, 25, 21841(2017).
[18] E. Siyu, Y.-N. Zhang, B. Han, W. Zheng, Q.-L. Wu, H.-K. Zheng. Two-channel surface plasmon resonance sensor for simultaneous measurement of seawater salinity and temperature. IEEE Trans. Instrum. Meas., 69, 7191(2020).
[19] M. D. Baiad, R. Kashyap. Concatenation of surface plasmon resonance sensors in a single optical fiber using tilted fiber Bragg gratings. Opt. Lett., 40, 115(2015).
[20] X. Chen, J. Xu, X. Zhang, T. Guo, B.-O. Guan. Wide range refractive index measurement using a multi-angle tilted fiber Bragg grating. IEEE Photon. Technol. Lett., 29, 719(2017).
[21] X. Wang, H. Deng, L. Yuan. Highly sensitive flexible SPR sensor based on side-polishing helical-core fiber: theoretical analysis and experimental demonstration. Adv. Photon. Res., 2, 2000054(2021).
[22] Y. N. Kulchin, O. Vitrik, A. Dyshlyuk. Analysis of surface plasmon resonance in bent single-mode waveguides with metal-coated cladding by eigenmode expansion method. Opt. Express, 22, 22196(2014).
[23] A. V. Dyshlyuk, O. B. Vitrik, Y. N. Kulchin, E. V. Mitsai, A. B. Cherepakhin, C. Branger, H. Brisset, T. V. Iordache, A. Sarbu. Numerical and experimental investigation of surface plasmon resonance excitation using whispering gallery modes in bent metal-clad single-mode optical fiber. J. Lightwave Technol., 35, 5425(2017).
[24] R. Slavı́k, J. Homola, J. Čtyroký. Single-mode optical fiber surface plasmon resonance sensor. Sens. Actuat. B: Chem., 54, 74(1999).
[25] D. P. Duarte, N. Alberto, L. Bilro, R. Nogueira. Theoretical design of a high sensitivity SPR-based optical fiber pressure sensor. J. Lightwave Technol., 33, 4606(2015).

Set citation alerts for the article
Please enter your email address
© Copyright 2018-2021 | Chinese Laser Press. All Rights Reserved 沪ICP备15018463号-20