• Chinese Optics Letters
  • Vol. 21, Issue 1, 011101 (2023)
Feifei Qin, Fan Shi, Xumin Gao, Jiabin Yan, Ziqi Ye, Yulong Su, Jianwei Fu, and Yongjin Wang*
Author Affiliations
  • Grünberg Research Centre, College of Telecommunications and Information Engineering, Nanjing University of Posts and Telecommunications, Nanjing 210003, China
  • show less
    DOI: 10.3788/COL202321.011101 Cite this Article Set citation alerts
    Feifei Qin, Fan Shi, Xumin Gao, Jiabin Yan, Ziqi Ye, Yulong Su, Jianwei Fu, Yongjin Wang. Self-filtering illumination source and application in fluorescence imaging[J]. Chinese Optics Letters, 2023, 21(1): 011101 Copy Citation Text show less
    Schematic diagram of sample preparation process: mesa the sample to expose the n-GaN surface (Step a to b), deposit of the ITO film (Step b to c), deposit of the electron (Step c to d), and deposit of the SiO2 and TiO2 filter layer in the back of the device (Step d to e). (f) CCD image of actual sample. (g) Cross SEM of the LED with a filter, the enlarged area shows the filter layer on the top and bottom pattern structure.
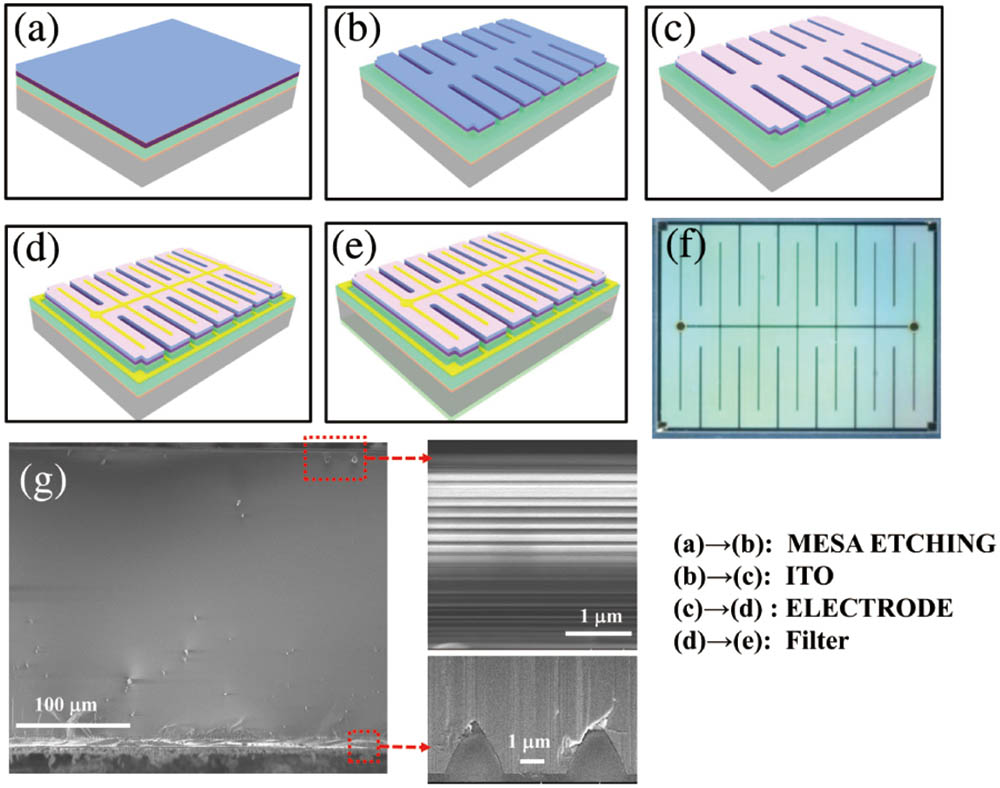
    Fig. 1. Schematic diagram of sample preparation process: mesa the sample to expose the n-GaN surface (Step a to b), deposit of the ITO film (Step b to c), deposit of the electron (Step c to d), and deposit of the SiO2 and TiO2 filter layer in the back of the device (Step d to e). (f) CCD image of actual sample. (g) Cross SEM of the LED with a filter, the enlarged area shows the filter layer on the top and bottom pattern structure.
    EL spectra of GaN LED (a) with or (b) without a filter. The inset shows the EL spectra of the device measured from the backside. (c) I-V curve of the LED, inset shows the CCD image of the device under electrical drive. EQE measurements and CIE chromaticity diagram of GaN LED (d) with or (e) without a filter.
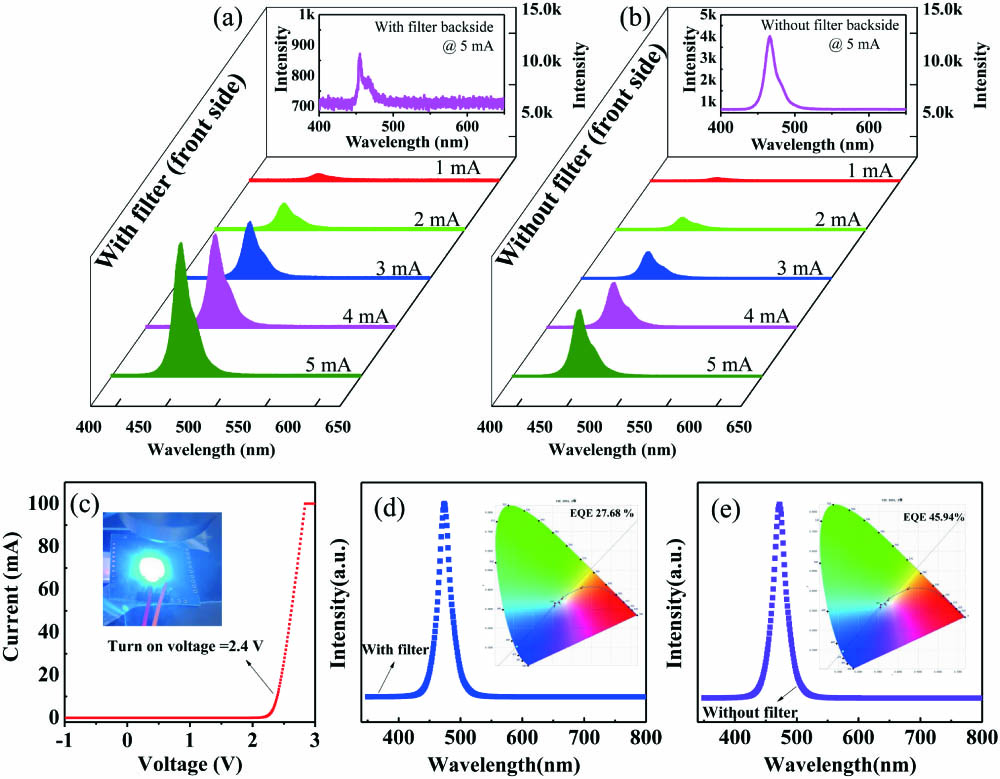
    Fig. 2. EL spectra of GaN LED (a) with or (b) without a filter. The inset shows the EL spectra of the device measured from the backside. (c) I-V curve of the LED, inset shows the CCD image of the device under electrical drive. EQE measurements and CIE chromaticity diagram of GaN LED (d) with or (e) without a filter.
    (a) Principle and experiment setup for fluorescence spectra of the LED device with a filter. (b) Current related fluorescence spectra of dye excited by a blue LED with a filter (collected on the backside). (c) Characteristic spectrum of fluorescence spectra in dye coated samples excited by blue LEDs with or without a filter. (d) Reflection spectrum at perpendicular incidence of GaN LEDs.
    Fig. 3. (a) Principle and experiment setup for fluorescence spectra of the LED device with a filter. (b) Current related fluorescence spectra of dye excited by a blue LED with a filter (collected on the backside). (c) Characteristic spectrum of fluorescence spectra in dye coated samples excited by blue LEDs with or without a filter. (d) Reflection spectrum at perpendicular incidence of GaN LEDs.
    Demonstration of fluorescence image and results for display of “N J U P T.”
    Fig. 4. Demonstration of fluorescence image and results for display of “N J U P T.”
    Feifei Qin, Fan Shi, Xumin Gao, Jiabin Yan, Ziqi Ye, Yulong Su, Jianwei Fu, Yongjin Wang. Self-filtering illumination source and application in fluorescence imaging[J]. Chinese Optics Letters, 2023, 21(1): 011101
    Download Citation