
Aihua Deng, Zixuan Zeng, Jianliao Deng. VIPA-based two-component detection for a coherent population trapping experiment[J]. Chinese Optics Letters, 2021, 19(8): 083001
- Chinese Optics Letters
- Vol. 19, Issue 8, 083001 (2021)
Abstract
1. Introduction
Coherent population trapping (CPT) is one of the most famous phenomena in quantum optics and provides an excellent example for showing quantum nature. It has been observed since 1976[
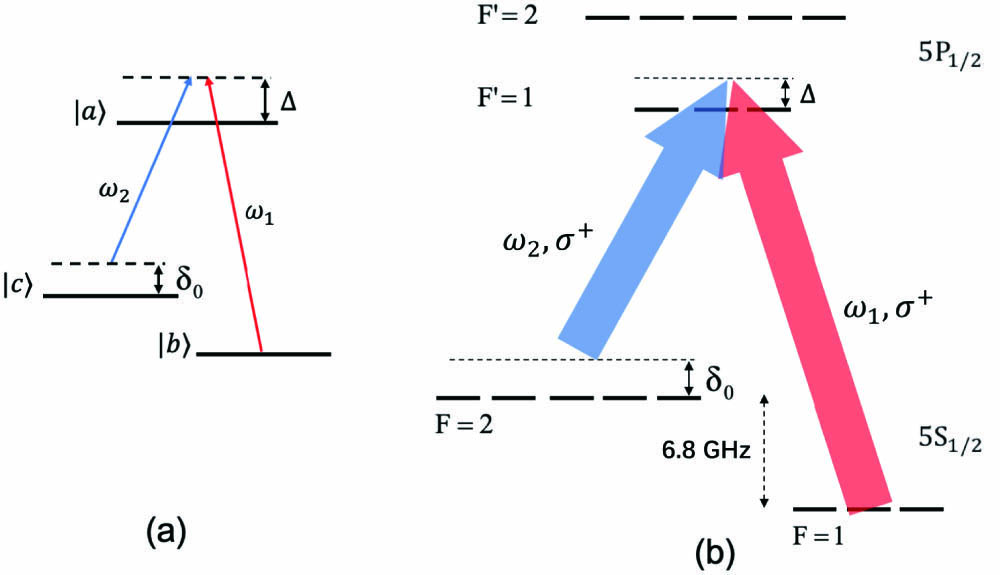
The simplest CPT structure involves three energy levels, as shown in Fig. 1(a), which is called the -type structure. The two coupling lights are associated with the frequencies of and , respectively, and the Rabi frequencies are and accordingly. They couple three levels of , and . is the single-photon detuning, and is the two-photon detuning. When , the CPT state is created, and less absorption happens at this point. The three-level model is very simple and captures the main physics, which we use as the main model for theoretic simulations. In the real experiments, of course, more hyperfine and Zeeman states are involved. Figure 1(b) shows the energy levels involved in our experiment with the D1 transition of . Two lasers are used to couple the hyperfine states and [
![]()
Figure 1.Λ-type energy structure of the CPT experiment. (a) The simple three-level model. (b) The energy levels involved in the real experiment. The main transitions are the D1 transitions of 87Rb.
Most CPT experiments detect the CPT signals with lights including both and frequency components, which we call one-component detection, and this total CPT signal is labelled as . It is easy and straightforward to detect the total CPT signal, and it gives better frequency stability for the CPT clock compared with the single-frequency component detection. Few experiments tried to extract the information about the individual frequency component by either the heterodyne-detected method[
Sign up for Chinese Optics Letters TOC. Get the latest issue of Chinese Optics Letters delivered right to you!Sign up now
Usually, the frequency difference between two coupling lights is in the gigahertz (GHz) regime (such as 6.8 GHz for Rb atom and 9.2 GHz for Cs atom). Even for a high resolution grating, it is hard to separate the coupling lights with such a high spectrum resolution. On the other hand, the virtually imaged phased array (VIPA), which is a rectangle etalon, provides a good solution to separate lights with such a frequency difference. It has been widely used for molecular spectroscopy[
2. Experimental Setup
The experimental setup is shown in Fig. 2. Figure 2(a) is the same as most conventional CPT experiments[
![]()
Figure 2.Experimental setup. (a) The main part of the CPT experiment. In order to change the single-photon detuning, the laser double passes an AOM before entering the Rb buffer-gas cell. After the cell, the laser is coupled into a fiber. (b) The detection part of our experiment. Lights with different frequencies are spatially separated by a VIPA. The pictures show the spatial distribution of lights. Three detectors are set to measure I1, I2, and Itotal, respectively. PBS, polarization beam splitter; BS, beam splitter; PD, photodetector; DAVLL, dichroic atomic vapor laser lock; VCSEL, vertical cavity surface emitting laser; VIPA, virtually imaged phased array; AOM, acoustic-optical modulator.
The main difference of our scheme, compared with traditional CPT scheme, is shown in Fig. 2(b). The laser coming out of the fiber is sent into a VIPA[
3. Simulations with a Three-Level Model
We first present some numerical results with the simple three-level model[
, represent the energy levels in Fig. 1(a). The Hamiltonian of the three-level model is
The simulation parameters are chosen to be the decay rate of the excited state , which is mainly due to collision with buffer gas, the relax rate of the populations of the two lower states , and the relax rate of the coherence between two lower states , and we change the Rabi frequencies and the detuning. Figure 3(a) shows the theoretical CPT lineshapes versus the two-photon detuning with the single-photon detuning , for , and . Although the single-photon detuning is not zero, is still quite symmetric with . But, and show strong asymmetry, and the center frequencies are shifted away from with opposite directions. But, , which can be considered as the sum of and , becomes more symmetric, and the center frequency is much closer to . That is part of the reason why is used to realize the CPT clock. Figures 3(b)–3(d) show the numerical results of how , and vary as we change when ; ; . In Fig. 3(b), we can clearly see that both and are insensitive with when . One can think that, because the intensity is balanced, the weights of and to are the same, so and show similar behaviors. But when , the weights are not the same for the two components, so the center frequencies show different behaviors, as shown in Figs. 3(c) and 3(d). Though and change a lot when changes, remains stable for a wide range of and , while has larger variations when . The numerical simulations with three-level model show that the frequency stability of is better than when the Rabi frequencies and the single-photon detuning change in certain regimes.
![]()
Figure 3.Numerical results with the simple three-level model. The simulation parameters are Γ/2π = 2000 MHz, γ1/2π = 1000 Hz, and γ2/2π = 5000 Hz. (a) Typical CPT signals for I1, I2, and Itotal when Δ/2π = −300 MHz, Ωab = 0.002Γ, Ωac = 0.001Γ. They are shifted vertically for a better visibility. (b)–(d) The center frequencies versus Δ when Ωab/Ωac equals (b) 1:1, (c) 1:1.5, and (d) 2:1. The results show that fave is insensitive against the change of Δ and Ωab/Ωac.
4. Experimental Results
The numerical findings are verified by experiments with the new detection scheme based on a VIPA. The experimental data are shown in Fig. 4. One typical CPT signal is shown in Fig. 4(a) when and . The signals of and show strong asymmetry, and is more symmetric, as predicted with the theoretic simulations. The center frequencies are extracted from the peaks of the CPT signals. Figure 4(b) presents the center frequencies versus . Each point contains three sets of data, and each set of data is averaged 4000 times. We fit the data in Fig. 4(b) with a linear function. The slope of is smaller than that of and , but larger than that of . This result is consistent with the ion from the three-level model. For real Rb atoms, more energy levels need to be considered. One can think that the real energy levels can be decomposed with multiple three-level sets. For each set, is more sensitive to than . When multiple sets work together, will be more sensitive to than .
![]()
Figure 4.Experimental data. (a) Typical CPT signals for I1, I2, and Itotal versus δ0 when Δ/2π = −190 MHz and Ωab/Ωac = 1:0.55. They are shifted vertically for better visibility. Both I1 and I2 show strong asymmetry, while Itotal is more symmetric. (b) The center frequencies versus Δ. Both f1 and f2 are very sensitive to Δ, but fave is insensitive to Δ. The slope of fave is smaller than that of ftotal.
In order to understand the results better, we perform a numerical simulation with a four-level model in Fig. 1(b) (here we ignore the Zeeman substates). Figure 5 shows the numerical results of a four-level CPT system. This simulation reflects the effect of the two upper levels of the Rb D1 transition () on the CPT signal. With the ground states, the two upper levels produce two sets of three-level systems and have opposite effects on the shift of the signal. Thus, we will find a cross of these lines between the two upper levels, where the single-photon detuning is not zero. The four-level model simulation confirms that is more sensitive to than , but still has some deviations compared with the experimental data quantitatively. The attenuation of light in the media, the Zeeman sublevels, and the order sideband of the modulated laser need to be considered for more precise numerical simulations[
![]()
Figure 5.Numerical results with the four-level model. The simulation parameters are Γ/2π = 2000 MHz, γ1/2π = 1000 Hz, and γ2/2π = 5000 Hz. Ωab/Ωac = 1:0.55.
5. Conclusion
We have demonstrated a two-component detection for the CPT experiment based on a VIPA. This detection allows us to study the asymmetric lineshapes with more detailed information. For example, with such a detection scheme, we could search the parameter regime where the averaged center frequency of the CPT signals is more insensitive to experimental parameters, such as the single-photon detuning and Rabi frequencies, than the total center frequency. It might be useful for building new CPT clocks with better frequency stability.
References
[1] G. Alzetta, A. Gozzini, L. Moi, G. Orriols. An experimental method for the observation of RF transitions and laser beat resonances in oriented Na vapour. Nuovo Cimento B, 36, 5(1976).
[2] E. Arimondo. Coherent population trapping in laser spectroscopy. Prog. Opt., 35, 257(1996).
[3] K. Bergmann, H. Theuer, B. W. Shore. Coherent population transfer among quantum states of atoms and molecules. Rev. Mod. Phys., 70, 1003(1998).
[4] M. Stahler, R. Wynands, S. Knappe, J. Kitching, L. Hollberg, A. Taichenachev, V. Yudin. Coherent population trapping resonances in thermal 85Rb vapor: D1 versus D2 line excitation. Opt. Lett., 27, 1472(2002).
[5] F.-X. Esnault, E. Blanshan, E. N. Ivanov, R. E. Scholten, J. Kitching, E. A. Donley. Cold-atom double-coherent population trapping clock. Phys. Rev. A, 88, 042120(2013).
[6] L. V. Hau, S. E. Harris, Z. Dutton, C. H. Behroozi. Light speed reduction to 17 metres per second in an ultracold atomic gas. Nature, 397, 594(1999).
[7] C. Santori, D. Fattal, S. M. Spillane, M. Fiorentino, R. G. Beausoleil, A. D. Greentree, P. Olivero, M. Draganski, J. R. Rabeau, P. Reichart, B. C. Gibson, S. Rubanov, D. N. Jamieson, S. Prawer. Coherent population trapping in diamond N-V centers at zero magnetic field. Opt. Express, 14, 7986(2006).
[8] J. Kitching, L. Hollberg, S. Knappe, R. Wynands. Compact atomic clock based on coherent population trapping. IEEE Xplore, 37, 1449(2001).
[9] J. Vanier. Atomic clocks based on coherent population trapping: a review. Appl. Phys. B, 81, 421(2005).
[10] J. F. DeNatale, R. L. Borwick, C. Tsai, P. A. Stupar, Y. Lin, R. A. Newgard, R. W. Berquist, M. Zhu. Compact, low-power chip-scale atomic clock. 2008 IEEE/ION Position, Location and Navigation Symposium, 67(2008).
[11] V. Shah, J. Kitching. Advances in coherent population trapping for atomic clocks. Adv. At. Mol. Opt. Phys., 59, 21(2010).
[12] Y. Sun, Y. Yao, Y. Hao, H. Yu, Y. Jiang, L. Ma. Laser stabilizing to ytterbium clock transition with Rabi and Ramsey spectroscopy. Chin. Opt. Lett., 18, 070201(2020).
[13] X. Wang, K. Liu, H. Cheng, W. Ren, J. Xiang, J. Ji, X. Peng, Z. Zhang, J. Zhao, M. Ye, L. Li, T. Li, B. Wang, Q. Qu, L. Liu, D. Lu. Optimization of temperature characteristics of a transportable 87Rb atomic fountain clock. Chin. Opt. Lett., 17, 080201(2019).
[14] K. Motomura, T. Koshimizu, K. I. Harada, H. Ueno, M. Mitsunaga. Subkilohertz linewidths measured by heterodyne-detected coherent population trapping in sodium vapor. Opt. Lett., 29, 1141(2004).
[15] M. Rosenbluh, V. Shah, S. Knappe, J. Kitching. Differentially detected coherent population trapping resonances excited by orthogonally polarized laser fields. Opt. Express, 14, 6588(2006).
[16] S. A. Diddams, L. Hollberg, V. Mbele. Molecular fingerprinting with the resolved modes of a femtosecond laser frequency comb. Nature, 445, 627(2007).
[17] A. Klose, G. Ycas, F. C. Cruz, D. L. Maser, S. A. Diddams. Rapid, broadband spectroscopic temperature measurement of CO using VIPA spectroscopy. Appl. Phys. B, 122, 78(2016).
[18] Z. Meng, V. V. Yakovlev. Precise determination of Brillouin scattering spectrum using a virtually imaged phase array (VIPA) spectrometer and charge-coupled device (CCD) camera. Appl. Spec., 70, 1356(2016).
[19] G. Scarcelli, S. H. Yun. Multistage VIPA etalons for high-extinction parallel Brillouin spectroscopy. Opt. Express, 19, 10913(2011).
[20] M. J. Thorpe, F. Adler, K. C. Cossel, M. H. G. de Miranda, J. Ye. Tomography of a supersonically cooled molecular jet using cavity-enhanced direct frequency comb spectroscopy. Chem. Phys. Lett., 468, 1(2009).
[21] M. J. Thorpe, D. Balslev-Clausen, M. S. Kirchner, J. Ye. Cavity-enhanced optical frequency comb spectroscopy: application to human breath analysis. Opt. Express, 16, 2387(2008).
[22] H. Lin, J. Deng, J. Lin, S. Zhang, Y. Wang. Frequency stability of a pulsed optically pumped atomic clock with narrow Ramsey linewidth. Appl. Opt., 57, 3056(2018).
[23] J. Lin, J. Deng, Y. Ma, H. He, Y. Wang. Detection of ultrahigh resonance contrast in vapor-cell atomic clocks. Opt. Lett., 37, 5036(2012).
[24] Y. Ma, J. Deng, Z. Hu, H. He, Y. Wang. High contrast transparent Ramsey fringes using microwave pulses interaction with atomic coherent state in warm rubidium vapor. Chin. Opt. Lett., 11, 032701(2013).
[25] B. Yan, Y. Ma, Y. Wang. Formation of Ramsey fringes based on pulsed coherent light storage. Phys. Rev. A, 79, 063820(2009).
[26] T. Xiao, T. Wang, B. Yan. A simple magnetic field design for dichroic atomic vapor laser lock. Rev. Sci. Instrum., 89, 046106(2018).
[27] M. Shirasaki. Large angular dispersion by a virtually imaged phased array and its application to a wavelength demultiplexer. Opt. Lett., 21, 366(1996).

Set citation alerts for the article
Please enter your email address
© Copyright 2018-2021 | Chinese Laser Press. All Rights Reserved 沪ICP备15018463号-20