• Opto-Electronic Advances
  • Vol. 4, Issue 2, 200031-1 (2021)
Hongtao Wang1、2、3、4, Chenglong Hao3, Han Lin1, Yongtian Wang2, Tian Lan2、*, Cheng-Wei Qiu3, and Baohua Jia1
Author Affiliations
  • 1Centre for Translational Atomaterials, Faculty of Science, Engineering and Technology, Swinburne University of Technology, P.O. Box 218, Hawthorn VIC 3122, Australia
  • 2Key Laboratory of Photoelectronic Imaging Technology and System, Ministry of Education of China, School of Optics and Photonics, Beijing Institute of Technology, Beijing 100081, China
  • 3Department of Electrical and Computer Engineering, National University of Singapore, 4 Engineering Drive 3, Singapore 117583, Singapore
  • 4Engineering Product Development Pillar, Singapore University of Technology and Design, 8 Somapah Road, 487372, Singapore.
  • show less
    DOI: 10.29026/oea.2021.200031 Cite this Article
    Hongtao Wang, Chenglong Hao, Han Lin, Yongtian Wang, Tian Lan, Cheng-Wei Qiu, Baohua Jia. Generation of super-resolved optical needle and multifocal array using graphene oxide metalenses[J]. Opto-Electronic Advances, 2021, 4(2): 200031-1 Copy Citation Text show less
    Schematic figures of GO metalens and its demonstrations. (a) Optical demonstration for optical needle generated by GO metalens. (b) Optical demonstration for four axial focal spots generated by GO metalens. (c) Schematic figure of GO metalens on a glass substrate, the total thickness is 200 nm. When reduced by femtosecond laser in RGO area, the absorption and refractive index increase while the thickness is reduced to 100 nm. (d) Phase-amplitude relationship of GO/RGO pairs. Three GO/RGO pairs on blue and brown lines, whose thicknesses are 200 nm/100 nm, 300 nm/150 nm, and 250 nm/125 nm, are labelled with dot (●), cross (+), and triangle (Δ), respectively. The first and the second numbers indicate the thickness of the initial GO films (e.g. 200 nm) and the thickness (e.g. 100 nm) of RGO after laser reduction. The transitional routes between GO/RGO pairs are plotted. The GO/RGO pairs with dot marker and transitional route 1 with solid lines are utilized in this work. The colorbar relates to thickness of the RGO film, which is controlled by the laser reduction extent.
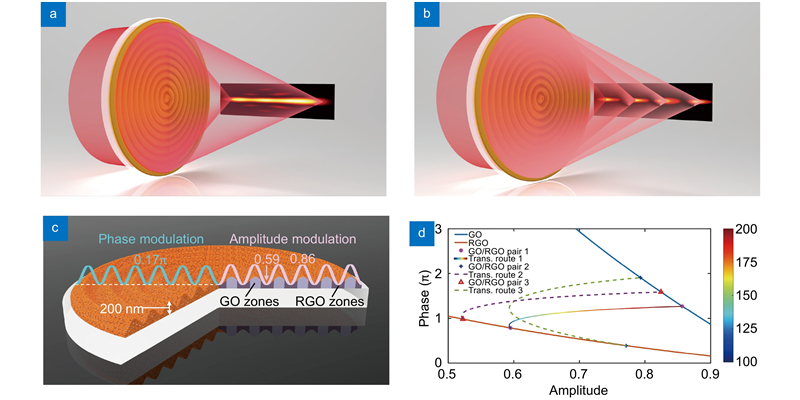
    Fig. 1. Schematic figures of GO metalens and its demonstrations. (a) Optical demonstration for optical needle generated by GO metalens. (b) Optical demonstration for four axial focal spots generated by GO metalens. (c) Schematic figure of GO metalens on a glass substrate, the total thickness is 200 nm. When reduced by femtosecond laser in RGO area, the absorption and refractive index increase while the thickness is reduced to 100 nm. (d) Phase-amplitude relationship of GO/RGO pairs. Three GO/RGO pairs on blue and brown lines, whose thicknesses are 200 nm/100 nm, 300 nm/150 nm, and 250 nm/125 nm, are labelled with dot (●), cross (+), and triangle (Δ), respectively. The first and the second numbers indicate the thickness of the initial GO films (e.g. 200 nm) and the thickness (e.g. 100 nm) of RGO after laser reduction. The transitional routes between GO/RGO pairs are plotted. The GO/RGO pairs with dot marker and transitional route 1 with solid lines are utilized in this work. The colorbar relates to thickness of the RGO film, which is controlled by the laser reduction extent.
    Characterization of GO metalens. (a) Optical image of GO metalens taken by an optical microscope with an objective of ×20, NA=0.5, the scale bar is 50 μm. (b) The zoom-in image of the up-right corner taken by an SEM, in which the scale bar is 5 μm. (c) Large-scale surface morphology of GO metalens measured by a 3D optical profiler. The scale bar is 20 μm. (d) The zoom-in image of the lower-right corner taken by an AFM. The scale bar is 4 μm.
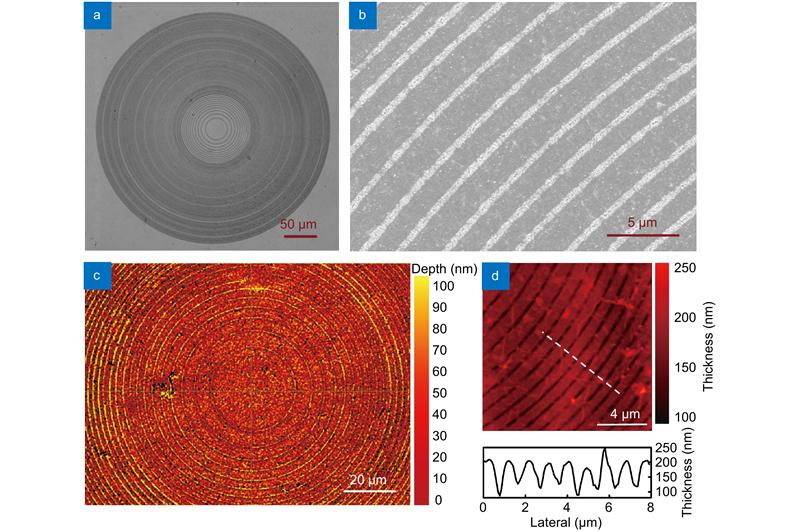
    Fig. 2. Characterization of GO metalens. (a) Optical image of GO metalens taken by an optical microscope with an objective of ×20, NA=0.5, the scale bar is 50 μm. (b) The zoom-in image of the up-right corner taken by an SEM, in which the scale bar is 5 μm. (c) Large-scale surface morphology of GO metalens measured by a 3D optical profiler. The scale bar is 20 μm. (d) The zoom-in image of the lower-right corner taken by an AFM. The scale bar is 4 μm.
    Focusing characterization of optical needle GO metalens. (a), (b) Normalized intensity distributions in the x-z plane from theoretical calculation and experiment, respectively. (c) Theoretical and experimental normalized intensity plots along optical axial in the focal region. (d) Theoretical lateral FWHM plot along z-direction near focal region and experimental FWHM points at the positions marked by the dash lines shown in (b) at 208 μm, 210 μm, 212 μm, 214 μm respectively. (e)−(h) Normalized intensity distributions at corresponding positions shown in (d), the lateral FWHMs at these positions are 0.81 λ, 0.74 λ, 0.73 λ, 0.70 λ.
    Fig. 3. Focusing characterization of optical needle GO metalens. (a), (b) Normalized intensity distributions in the x-z plane from theoretical calculation and experiment, respectively. (c) Theoretical and experimental normalized intensity plots along optical axial in the focal region. (d) Theoretical lateral FWHM plot along z-direction near focal region and experimental FWHM points at the positions marked by the dash lines shown in (b) at 208 μm, 210 μm, 212 μm, 214 μm respectively. (e)−(h) Normalized intensity distributions at corresponding positions shown in (d), the lateral FWHMs at these positions are 0.81 λ, 0.74 λ, 0.73 λ, 0.70 λ.
    Focusing characterization of axial multifocal spots GO metalens. (a), (b) Normalized intensity distributions in the x-z plane from theoretical calculation and experiments, respectively. (c) Theoretical and experimental normalized intensity plots along the optical axial in the focal region. (d)−(g) Normalized intensity distributions at positions marked by the dashed lines shown in (b), the axial positions are 202 μm, 206 μm, 212 μm, 218 μm. The lateral FWHMs at these positions are 0.97 λ, 0.94 λ, 0.87 λ, 0.91 λ.
    Fig. 4. Focusing characterization of axial multifocal spots GO metalens. (a), (b) Normalized intensity distributions in the x-z plane from theoretical calculation and experiments, respectively. (c) Theoretical and experimental normalized intensity plots along the optical axial in the focal region. (d)−(g) Normalized intensity distributions at positions marked by the dashed lines shown in (b), the axial positions are 202 μm, 206 μm, 212 μm, 218 μm. The lateral FWHMs at these positions are 0.97 λ, 0.94 λ, 0.87 λ, 0.91 λ.
    Hongtao Wang, Chenglong Hao, Han Lin, Yongtian Wang, Tian Lan, Cheng-Wei Qiu, Baohua Jia. Generation of super-resolved optical needle and multifocal array using graphene oxide metalenses[J]. Opto-Electronic Advances, 2021, 4(2): 200031-1
    Download Citation