• Advanced Photonics
  • Vol. 3, Issue 1, 016003 (2021)
Zhen Qiao1, Xuerui Gong1, Peng Guan2, Zhiyi Yuan1, Shilun Feng3, Yiyu Zhang1, Munho Kim1, Guo-En Chang4, and Yu-Cheng Chen1、5、*
Author Affiliations
  • 1Nanyang Technological University, School of Electrical and Electronic Engineering, Singapore
  • 2Shanghai Jiao Tong University, School of Electronic Information and Electrical Engineering, Shanghai, China
  • 3Chinese Academy of Sciences, Shanghai Institute of Microsystem and Information Technology, State Key Laboratory of Transducer Technology, Shanghai, China
  • 4Taiwan Chung Cheng University, Department of Mechanical Engineering, Minhsiung, Chiayi, China
  • 5Nanyang Technological University, School of Chemical and Biomedical Engineering, Singapore
  • show less
    DOI: 10.1117/1.AP.3.1.016003 Cite this Article Set citation alerts
    Zhen Qiao, Xuerui Gong, Peng Guan, Zhiyi Yuan, Shilun Feng, Yiyu Zhang, Munho Kim, Guo-En Chang, Yu-Cheng Chen. Lasing action in microdroplets modulated by interfacial molecular forces[J]. Advanced Photonics, 2021, 3(1): 016003 Copy Citation Text show less
    Concept and principle of droplet lasers hosting AL modes based on different hydrophobic forces at droplet–solid interfaces. (a) Schematic of a droplet laser hosting AL modes. A dye-doped droplet is formed on a highly reflective dielectric mirror. AL modes will oscillate from strong reflections between the mirror and the droplet–air interface. (b) Enlarged schematic of the droplet–solid interface in (a). A molecular layer is deposited between the mirror and the droplet. The droplet–solid interfacial tension γi, the solid surface tension γs, and the droplet surface tension γl commonly determine the contact angle α. (c) AL oscillation paths under different contact angles. It is worth noting that AL modes will follow the paths corresponding to segments of N-sided polygons. As the contact angle increases, AL modes with a larger N will be excited. (d) The simulated normalized electric field distributions of AL modes under different contact angles in (c).
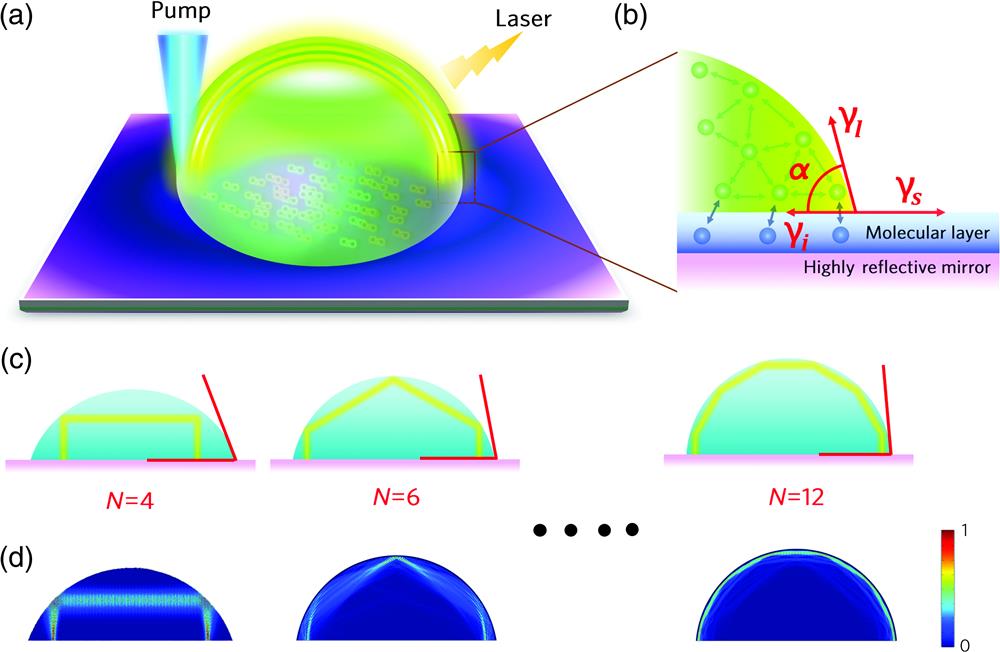
    Fig. 1. Concept and principle of droplet lasers hosting AL modes based on different hydrophobic forces at droplet–solid interfaces. (a) Schematic of a droplet laser hosting AL modes. A dye-doped droplet is formed on a highly reflective dielectric mirror. AL modes will oscillate from strong reflections between the mirror and the droplet–air interface. (b) Enlarged schematic of the droplet–solid interface in (a). A molecular layer is deposited between the mirror and the droplet. The droplet–solid interfacial tension γi, the solid surface tension γs, and the droplet surface tension γl commonly determine the contact angle α. (c) AL oscillation paths under different contact angles. It is worth noting that AL modes will follow the paths corresponding to segments of N-sided polygons. As the contact angle increases, AL modes with a larger N will be excited. (d) The simulated normalized electric field distributions of AL modes under different contact angles in (c).
    Demonstration of lasing action. (a) Schematic of a round droplet on a glass slide. (b) The optical spectrum of the droplet on a glass slide showing no laser emission. Inset: top-view profile of a round droplet on a glass slide (top) and the optical image after pumping (below). (c) Schematic of a round droplet on a highly reflective mirror. (d) The optical spectrum of the round droplet on the mirror showing laser emission. Inset: top-view profile of a round droplet on a mirror (top) and the optical image after pumping (below). (e) Schematic of a “deformed” droplet on a highly reflective mirror. (f) The optical spectrum of the “deformed” droplet showing laser emission. Insets: top-view profile of the “deformed” droplet (top) and the optical image after pumping (below). Scale bars in insets: 20 μm. (g) Optical spectra of a droplet resonator with increasing pump energy densities. Inset: optical image of the droplet laser. (h) Enlarged spectra of the droplet resonator under the pump energy of 72.6 μJ/mm2 (below threshold) and 108.1 μJ/mm2 (above threshold). FWHM: full width at half-maximum. (i) Spectrally integrated output intensity and linewidth as a function of pump energy density [extracted from (g)]. FITC concentration: 2 mM.
    Fig. 2. Demonstration of lasing action. (a) Schematic of a round droplet on a glass slide. (b) The optical spectrum of the droplet on a glass slide showing no laser emission. Inset: top-view profile of a round droplet on a glass slide (top) and the optical image after pumping (below). (c) Schematic of a round droplet on a highly reflective mirror. (d) The optical spectrum of the round droplet on the mirror showing laser emission. Inset: top-view profile of a round droplet on a mirror (top) and the optical image after pumping (below). (e) Schematic of a “deformed” droplet on a highly reflective mirror. (f) The optical spectrum of the “deformed” droplet showing laser emission. Insets: top-view profile of the “deformed” droplet (top) and the optical image after pumping (below). Scale bars in insets: 20  μm. (g) Optical spectra of a droplet resonator with increasing pump energy densities. Inset: optical image of the droplet laser. (h) Enlarged spectra of the droplet resonator under the pump energy of 72.6  μJ/mm2 (below threshold) and 108.1  μJ/mm2 (above threshold). FWHM: full width at half-maximum. (i) Spectrally integrated output intensity and linewidth as a function of pump energy density [extracted from (g)]. FITC concentration: 2 mM.
    Characterization of the AL modes through FSRs. (a) Side-view profile of a droplet. α, contact angle. D, diameter. Black dot circle, the complete circle containing the droplet profile. Blue line, an N-sided polygon containing the AL mode oscillation path (solid blue line). l, side length of an N-sided polygon. h, length of the two vertical short sides. (b) Measured FSRs (blue triangles) and the theoretical lines calculated by considering WGM (black line) and AL modes (colored lines). (c)–(e) The optical spectra of droplet resonators with the contact angles of (c) 69 deg, (d) 79 deg, and (e) 85 deg, respectively. Insets: CCD images of lasing emissions from individual droplets. (f) Simulated electric field distribution of the AL mode with N=4 calculated through the FSR in (c). (g) Simulated electric field distributions of the AL modes with N=4 and N=6 calculated through the FSRs in (d). (h) Simulated electric field distributions of the AL modes with N=6, N=8, N=10, and N=20 calculated through the FSRs in (e). FITC concentration: 2 mM. Pump energy density: 78 μJ/mm2.
    Fig. 3. Characterization of the AL modes through FSRs. (a) Side-view profile of a droplet. α, contact angle. D, diameter. Black dot circle, the complete circle containing the droplet profile. Blue line, an N-sided polygon containing the AL mode oscillation path (solid blue line). l, side length of an N-sided polygon. h, length of the two vertical short sides. (b) Measured FSRs (blue triangles) and the theoretical lines calculated by considering WGM (black line) and AL modes (colored lines). (c)–(e) The optical spectra of droplet resonators with the contact angles of (c) 69 deg, (d) 79 deg, and (e) 85 deg, respectively. Insets: CCD images of lasing emissions from individual droplets. (f) Simulated electric field distribution of the AL mode with N=4 calculated through the FSR in (c). (g) Simulated electric field distributions of the AL modes with N=4 and N=6 calculated through the FSRs in (d). (h) Simulated electric field distributions of the AL modes with N=6, N=8, N=10, and N=20 calculated through the FSRs in (e). FITC concentration: 2 mM. Pump energy density: 78  μJ/mm2.
    Lasing action of droplet lasers under different hydrophobicity. (a) Top: side-view profiles of droplets with varying contact angles. Below: optical images of the droplets after pumping. Yellow boxes, the laser emission regions. Red dashed circle in the CCD images represents excitation pump regions. Scale bar: 20 μm. (b) Statistics of spectrally integrated laser outputs at different interfacial tensions and contact angles under the same pump energy density. Inset: spectrally integrated laser outputs as a function of pump energy density at contact angles of 75 deg, 79 deg, 85 deg, and 90 deg. (c) Optical spectra of droplet resonators with different interfacial tensions. Inset: laser linewidths under different contact angles. (d) Calculated Q-factors and the maximum number of AL oscillation paths as a function of contact angle. (e) Simulated electric field distributions and Q-factors of the AL modes with N=4, 6, and 8 under the same contact angle of 83 deg. (f) Simulated electric field distributions and Q-factors of the AL modes with N=4, 12, and ∞ for respective contact angles of 67 deg, 83 deg, and 90 deg. FITC concentration: 2 mM. Pump energy density: 78 μJ/mm2. Calculation parameters: volume of droplets=68.5 pL; refractive index=1.41. Interfacial tension calculations:34" target="_self" style="display: inline;">34–36" target="_self" style="display: inline;">–36 refer to Sec. 2 in the Supplementary Material.
    Fig. 4. Lasing action of droplet lasers under different hydrophobicity. (a) Top: side-view profiles of droplets with varying contact angles. Below: optical images of the droplets after pumping. Yellow boxes, the laser emission regions. Red dashed circle in the CCD images represents excitation pump regions. Scale bar: 20  μm. (b) Statistics of spectrally integrated laser outputs at different interfacial tensions and contact angles under the same pump energy density. Inset: spectrally integrated laser outputs as a function of pump energy density at contact angles of 75 deg, 79 deg, 85 deg, and 90 deg. (c) Optical spectra of droplet resonators with different interfacial tensions. Inset: laser linewidths under different contact angles. (d) Calculated Q-factors and the maximum number of AL oscillation paths as a function of contact angle. (e) Simulated electric field distributions and Q-factors of the AL modes with N=4, 6, and 8 under the same contact angle of 83 deg. (f) Simulated electric field distributions and Q-factors of the AL modes with N=4, 12, and for respective contact angles of 67 deg, 83 deg, and 90 deg. FITC concentration: 2 mM. Pump energy density: 78  μJ/mm2. Calculation parameters: volume of droplets=68.5  pL; refractive index=1.41. Interfacial tension calculations:3436" target="_self" style="display: inline;">36 refer to Sec. 2 in the Supplementary Material.
    Modulating laser emission with intermolecular forces at the biointerface. (a) Schematic of biointerface modulating laser emissions based on biomolecular adsorptions with different concentrations. Higher concentration of biomolecules leads to smaller interfacial tension γi and lower laser intensity. (b) Interfacial tensions (top), contact angles (top), and spectrally integrated laser outputs (bottom) as a function of BSA concentration. (c), (d) Contact angles and spectrally integrated laser outputs as a function of different biomolecular concentration, including (c) insulin and (d) V5 peptide. Insets in (b) (top), (c), and (d): side views of droplets with different biomolecular concentrations. Inset in (b) (bottom): CCD images of lasing emissions under different concentrations, where the emission regions are marked with yellow boxes. FITC concentration: 4 mM. Pump energy density: 36 μJ/mm2. Interfacial tension calculations:38" target="_self" style="display: inline;">38,39" target="_self" style="display: inline;">39 refer to Sec. 2 in the Supplementary Material.
    Fig. 5. Modulating laser emission with intermolecular forces at the biointerface. (a) Schematic of biointerface modulating laser emissions based on biomolecular adsorptions with different concentrations. Higher concentration of biomolecules leads to smaller interfacial tension γi and lower laser intensity. (b) Interfacial tensions (top), contact angles (top), and spectrally integrated laser outputs (bottom) as a function of BSA concentration. (c), (d) Contact angles and spectrally integrated laser outputs as a function of different biomolecular concentration, including (c) insulin and (d) V5 peptide. Insets in (b) (top), (c), and (d): side views of droplets with different biomolecular concentrations. Inset in (b) (bottom): CCD images of lasing emissions under different concentrations, where the emission regions are marked with yellow boxes. FITC concentration: 4 mM. Pump energy density: 36  μJ/mm2. Interfacial tension calculations:38,39 refer to Sec. 2 in the Supplementary Material.
    Zhen Qiao, Xuerui Gong, Peng Guan, Zhiyi Yuan, Shilun Feng, Yiyu Zhang, Munho Kim, Guo-En Chang, Yu-Cheng Chen. Lasing action in microdroplets modulated by interfacial molecular forces[J]. Advanced Photonics, 2021, 3(1): 016003
    Download Citation