Andrey A. Bogdanov1、2, Kirill L. Koshelev1、3, Polina V. Kapitanova1, Mikhail V. Rybin1、2, Sergey A. Gladyshev1, Zarina F. Sadrieva1, Kirill B. Samusev1、2, Yuri S. Kivshar1、3、*, and Mikhail F. Limonov1、2
Author Affiliations
1ITMO University, Department of Nanophotonics and Metamaterials, St. Petersburg, Russia2Ioffe Institute, St. Petersburg, Russia3Australian National University, Nonlinear Physics Center, Canberra, Australiashow less
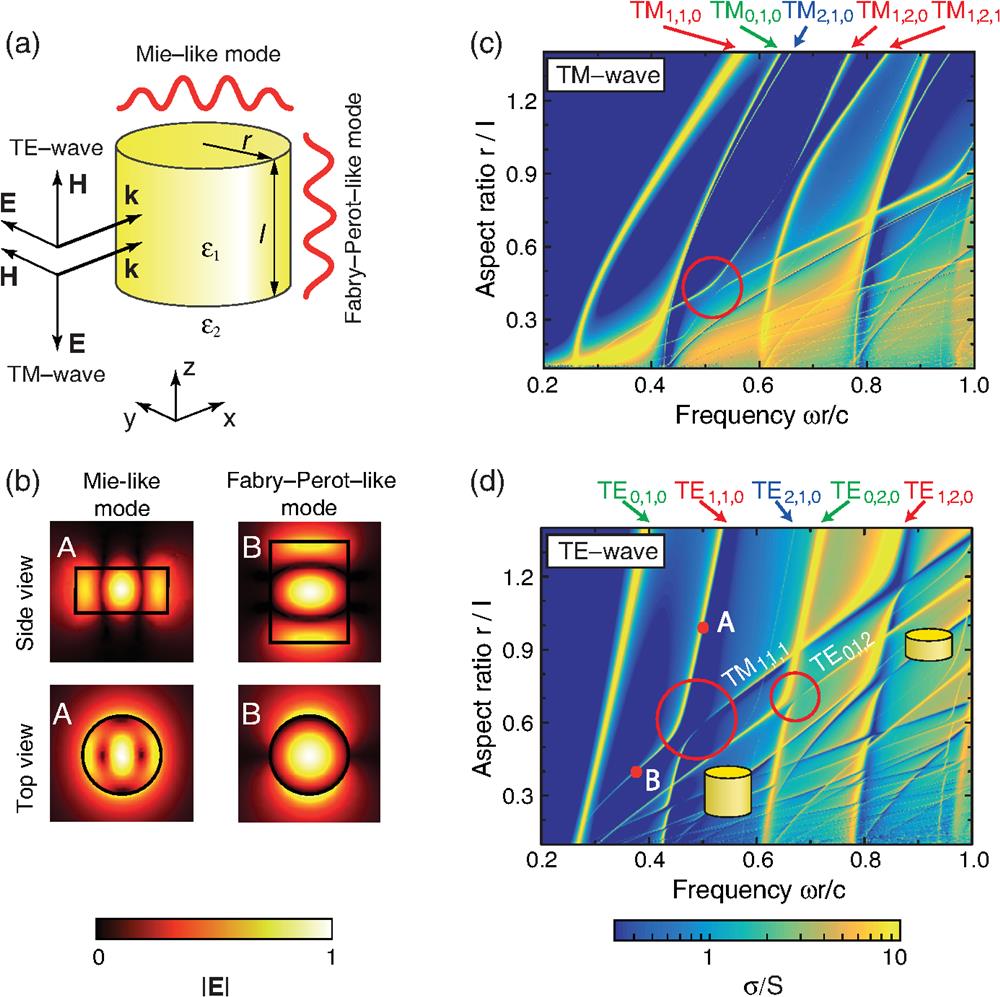
Fig. 1. Strong coupling of modes in a dielectric resonator. (a) TE- and TM-polarized waves incident on a dielectric cylindrical resonator with permittivity , radius , and length placed in vacuum (). (b) Distribution of the electric field amplitude for the Mie-like mode (point A) and Fabry–Perot-like mode (point B). (c) and (d) Dependencies of the total SCS of the cylinder normalized to the projected cross-section on the aspect ratio of the cylinder and frequency for TM and TE-polarized incident waves, respectively. The calculations are carried out with the step of . In panels (c) and (d), the regions of the most pronounced avoided crossing are marked by red circles.
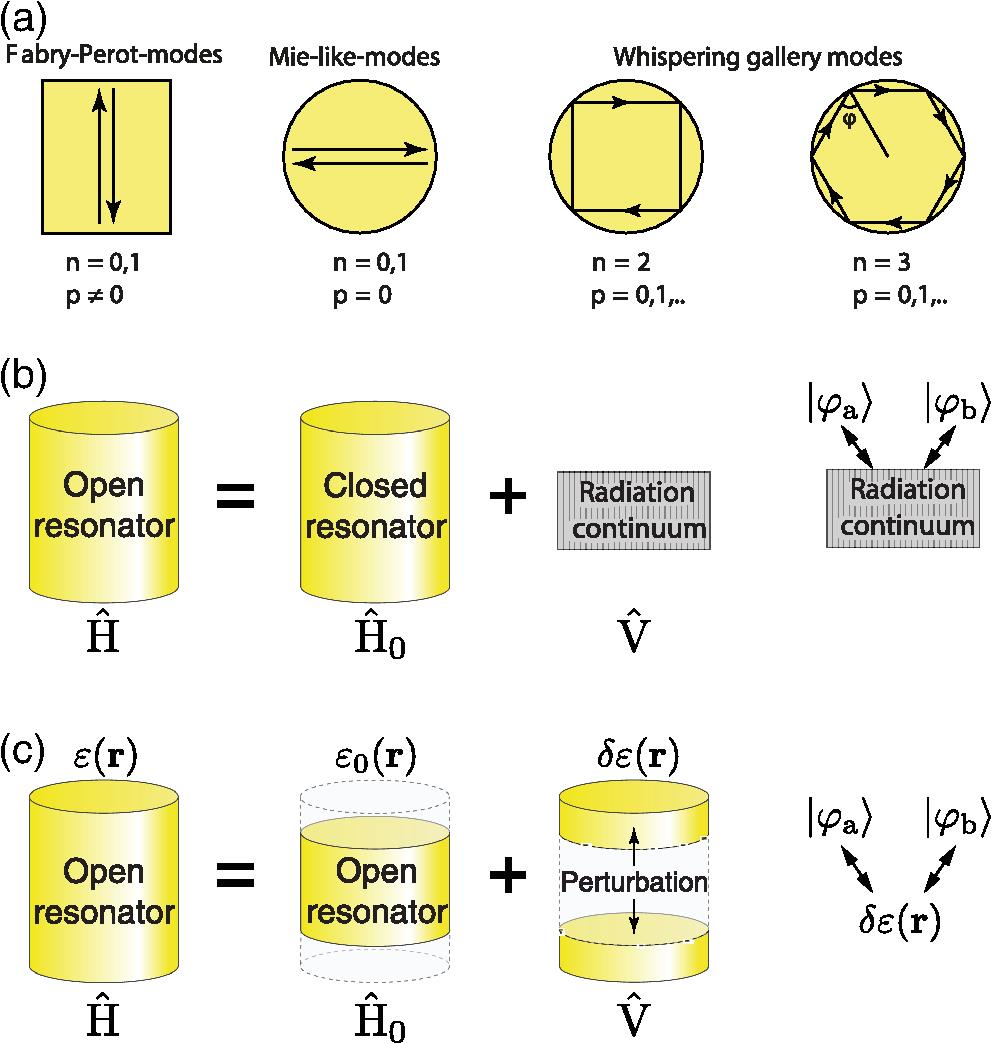
Fig. 2. Modes of a dielectric resonator and models of their coupling. (a) Classification of eigenmodes of a dielectric resonator. (b) Friedrich–Wintgen approach describing an open cylindrical resonator as a closed resonator and a radiation continuum. Eigenmodes of the resonator interact via the radiation continuum. (c) Non-Hermitian approach describing an open cylindrical resonator by a complex spectrum of eigenfrequencies. Eigenmodes of the resonator interact via perturbation responsible for change in the resonator aspect ratio.
Fig. 3. Avoided resonance crossing, -factor, and Fano resonance. (a) Spectra of the normalized total SCS of the cylinder resonator as a function of its aspect ratio in the region of the avoided resonance crossing between the modes and . (b) Peak positions for the low- and high-frequency modes in the spectra. (c) and (d) Evolution of the quality-factor , the peak amplitude [see Eq. (2)], and the Fano asymmetry parameter [see Eq. (3)] for the high-frequency mode.
Fig. 4. Relationship between Fano parameter and -factor. (a) Artistic view of the open resonator which radiates into the main open channel and other minor channels . (b) Dependence of the inverse radiation lifetime on the cylinder aspect ratio for the high-frequency mode (see Fig. 3). (c) Dependence of the phase shift Δ on the aspect ratio . (d) Dependence of the zero-order radiation amplitudes and on the aspect ratio . (e) Dependence of the first-order corrections to the radiation amplitudes, and on the aspect ratio .
Fig. 5. Multipole decomposition for mode. (a) Contribution of the electric dipole and magnetic quadrupole to the radiated power of mode. (b) Far-field radiation patterns of mode for different aspect ratios. Panel B corresponds to the quasi-BIC.
Fig. 6. Two-band approximation of strong mode coupling. Comparison of the exact solution and approximate two-band model of strong coupling between the modes and . Green dashed lines are visual guides.
Fig. 7. Effect of material losses on the regime of strong coupling and quasi-BIC. (a) Dependence of the total quality-factor on the aspect ratio for various levels of material losses. (b) Dependence of Rabi frequency and sum of half linewidths of the coupled modes on the level of material losses. Insets visualize the ratio between ΩR and linewidths. Here, and are the damping rates of the modes of the diagonalized Hamiltonian [Eq. (10)].
Fig. 8. Experimental results. (a) Experimental setup for the measurement of SCS spectra of the cylindrical resonator filled with water depending on its aspect ratio
and frequency
. (b) Measured SCS map demonstrating the avoided crossing regime between
and
resonances. The circles are the real part of eigenfrequencies obtained from the resonant-state expansion method for a dielectric cylinder with the permittivity
embedded in air (
). (c) Calculated SCS map of the cylindrical resonator filled with water depending on the frequency
and aspect ratio
. The frequency dispersion of the water permittivity is taken from Ref.
61.
Fig. 9. Complex spectrum of eigenmodes. The spectrum is shown for the modes with the azimuthal index (red dotted lines) and (blue dotted lines), which are even with respect to () symmetry. Dot sizes are proportional to -factor. The region of the avoided crossing between modes and is marked by the green ellipse. Calculations are performed by using the resonant-state expansion method.