
Bingshuang Yao, Xiaofei Zang, Yang Zhu, Dahai Yu, Jingya Xie, Lin Chen, Sen Han, Yiming Zhu, Songlin Zhuang. Spin-decoupled metalens with intensity-tunable multiple focal points[J]. Photonics Research, 2021, 9(6): 1019
- Photonics Research
- Vol. 9, Issue 6, 1019 (2021)
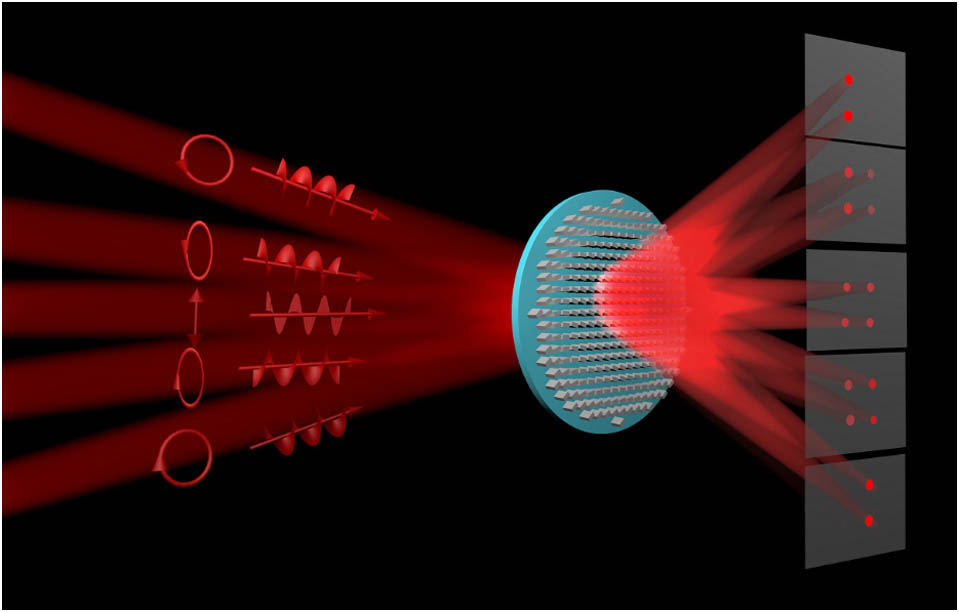
Fig. 1. Schematic of the spin-decoupled metalens with intensity-tunable multiple focal points. Under the illumination of LCP THz waves, two RCP focal points are generated, while two LCP focal points can be observed for the incident RCP THz waves. The intensity between two RCP focal points and two LCP focal points can be arbitrarily modulated with different weights of LCP and RCP incident THz waves.
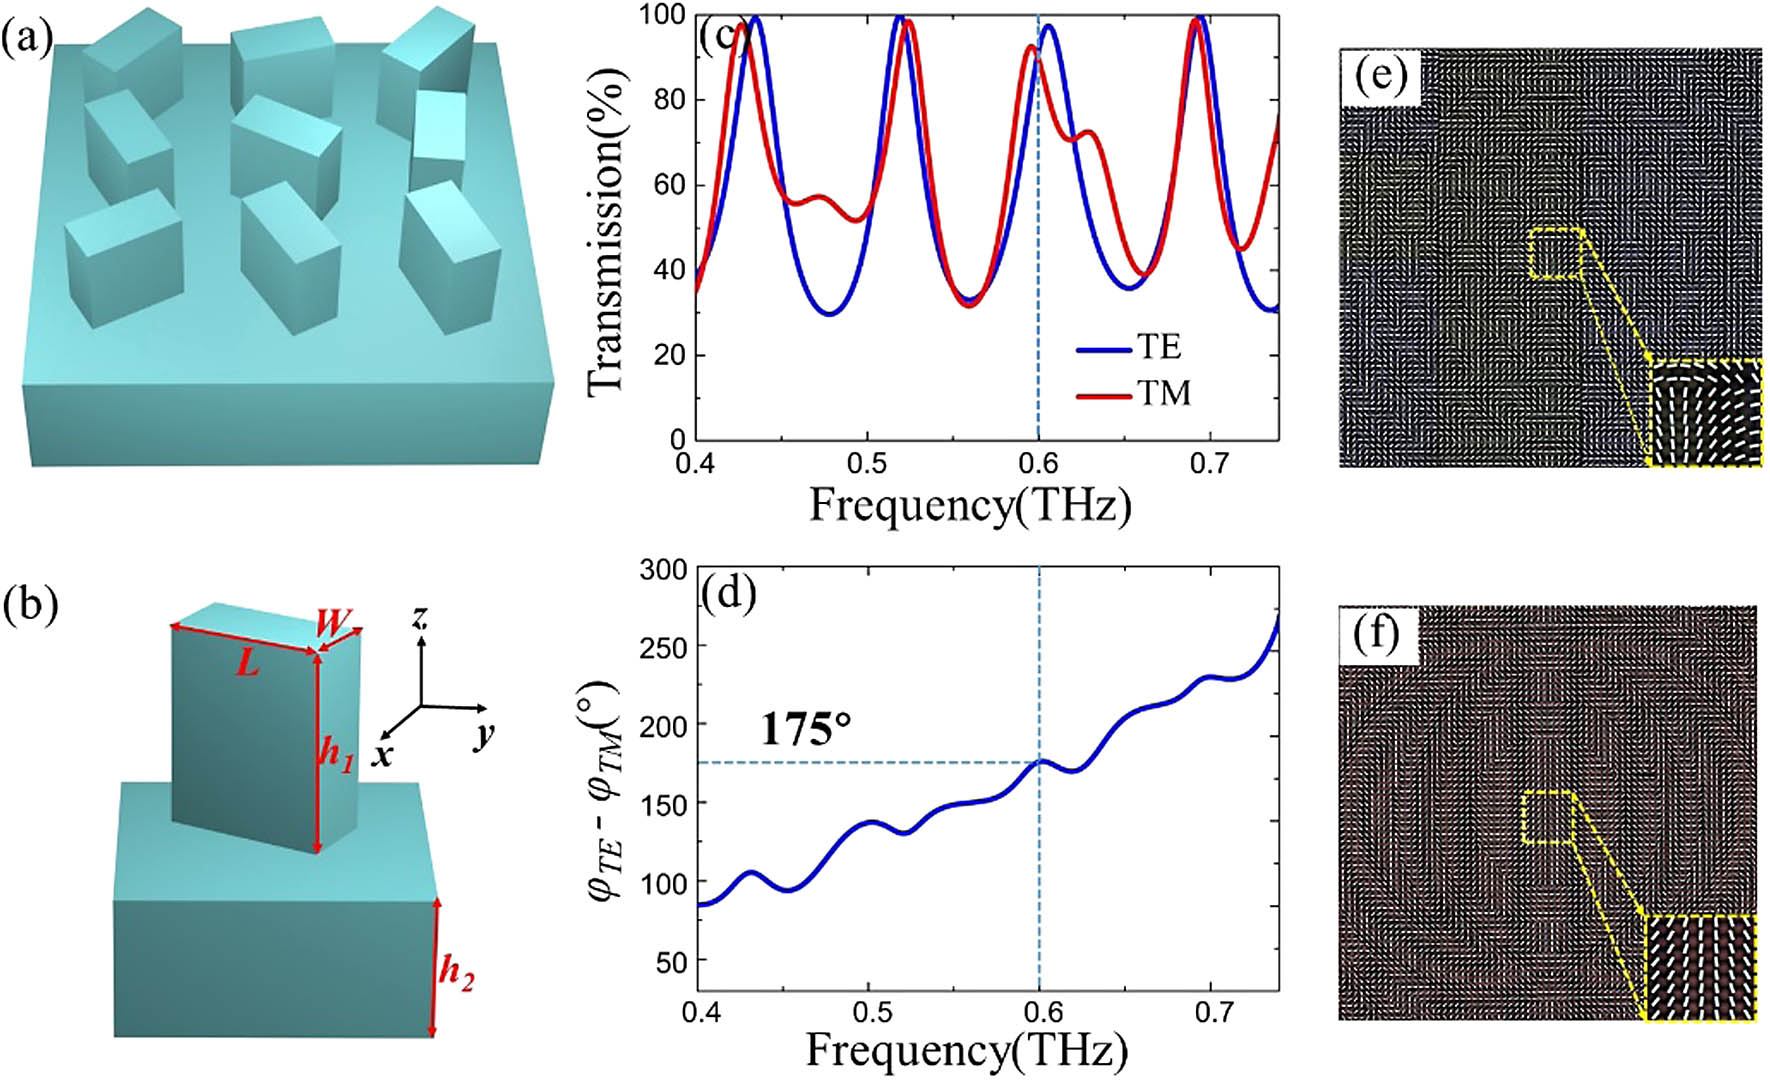
Fig. 2. Schematic, principle, and fabrication of the spin-decoupled metalens. (a) Schematic of the spin Hall metalens consisting of a variety of silicon microrods with identical shape but different orientations. (b) Unit cell of the microrod. (c) The transmission spectra of microrods under the illumination of TE and TM THz waves. (d) The corresponding phase difference between the transmitted TE and TM THz waves. (e) and (f) Optical images of the fabricated spin-decoupled metalenses that can generate transversely distributed and longitudinally distributed RCP and LCP multiple focal points, respectively.
Fig. 3. Electric-field intensity distributions (| E | 2 x − y z = 3.75 mm y = 1.5 mm z = 3.75 mm
Fig. 4. Electric-field intensity distributions (| E | 2 x − z y = 0 mm z = 3.75 mm
Fig. 5. Calculated and measured electric-field intensity distributions at line y = − 1.5 mm z = 3.75 mm
Fig. 6. Electric-field intensity distributions (under the illumination of THz waves with polarization switched from LCP to RCP) at the x − z
Fig. 7. Simulated electric-field intensities (| E | 2 | E | 2 − 1.5 | E | 2 − 1.5 − 1.5 − 1.5
Fig. 8. Calculated and measured electric-field intensity distributions at line z = 5.75 mm x = 0 mm
Fig. 9. Electric-field intensity distributions (under the illumination of THz waves with polarization switched from LCP to RCP) at the x − y z = 3.75 mm
Fig. 10. Electric-field intensity distributions (under the illumination of THz waves with polarization switched from LCP to RCP) at the x − y z = 5.7 mm
Fig. 11. Simulated electric-field intensities (| E | 2 | E | 2 − 1.0 | E | 2 − 1.5

Set citation alerts for the article
Please enter your email address
© Copyright 2018-2021 | Chinese Laser Press. All Rights Reserved 沪ICP备15018463号-20