
Guangshuai WANG, Yi WAN, Yongjun ZHANG. Registration of Airborne LiDAR Data and Multi-View Aerial Images Constrained by Junction Structure Features [J]. Journal of Geo-information Science, 2020, 22(9): 1868
- Journal of Geo-information Science
- Vol. 22, Issue 9, 1868 (2020)
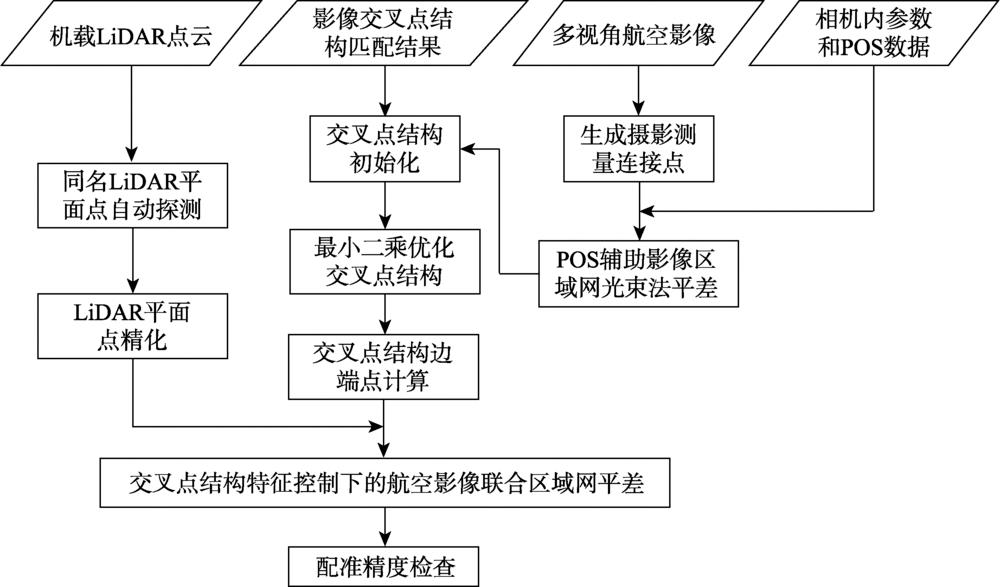
Fig. 1. Flowchart of the proposed registration method
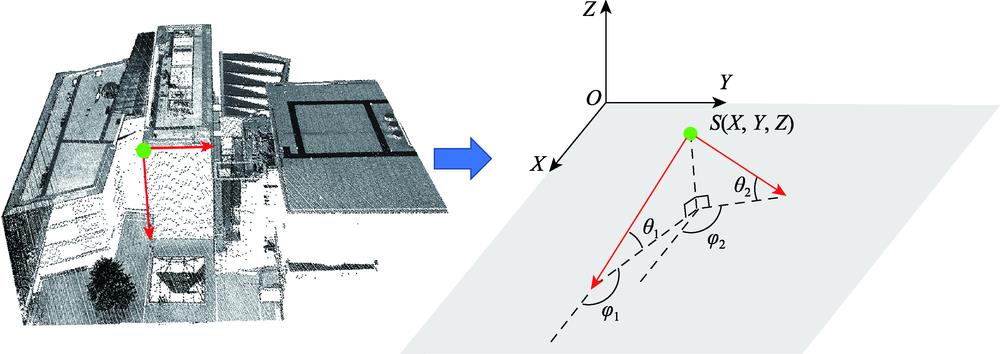
Fig. 2. Schematic illustration of the junction structure
Fig. 3. Projection geometry of the junction structure in two-views
Fig. 4. Automatic detection of conjugate LiDAR plane points
Fig. 5. Registration model under constraints of junction structure features
Fig. 6. Overview of the image data and LiDAR point cloud for the Guangzhou data set
Fig. 7. Overview of check points for the Ningbo data set
Fig. 8. Measurements of image junction structures for the Guangzhou data set
Fig. 9. LiDAR point cloud colored by aerial images for the Guangzhou data set
Fig. 10. Comparison of the fitness of LiDAR points to images before and after registration for the Guangzhou data
Fig. 11. Comparison of the fitness of LiDAR points to images before and after registration for the Ningbo data
Fig. 12. Comparison of registration accuracy using thinning point clouds for the Guangzhou data set
Fig. 13. Comparison of registration accuracy using thinning point clouds for the Ningbo data set
| ||||||||||||||||||||||||||||||||||
Table 1. Details of the experimental data
| ||||||||||||||||||||||||||||
Table 2. Comparison of registration accuracy for the Guangzhou data set
| ||||||||||||||||||||||||||||||||||||||||||||||
Table 3. Comparison of check points residuals for the Ningbo data set

Set citation alerts for the article
Please enter your email address
© Copyright 2018-2021 | Chinese Laser Press. All Rights Reserved 沪ICP备15018463号-20