• Journal of Geographical Sciences
  • Vol. 30, Issue 5, 823 (2020)
Zhaohua SUN1、*, Jiewei FAN1, Xin YAN1, and Cuisong XIE2
Author Affiliations
  • 1State Key Laboratory of Water Resources and Hydropower Engineering Science, Wuhan University, Wuhan 430072, China
  • 2Shanghai Water Affairs Bureau, Shanghai 200050, China
  • show less
    DOI: 10.1007/s11442-020-1757-0 Cite this Article
    Zhaohua SUN, Jiewei FAN, Xin YAN, Cuisong XIE. Analysis of critical river discharge for saltwater intrusion control in the upper South Branch of the Yangtze River Estuary[J]. Journal of Geographical Sciences, 2020, 30(5): 823 Copy Citation Text show less
    Sketch of the Yangtze River Estuary displaying the location of measuring stations
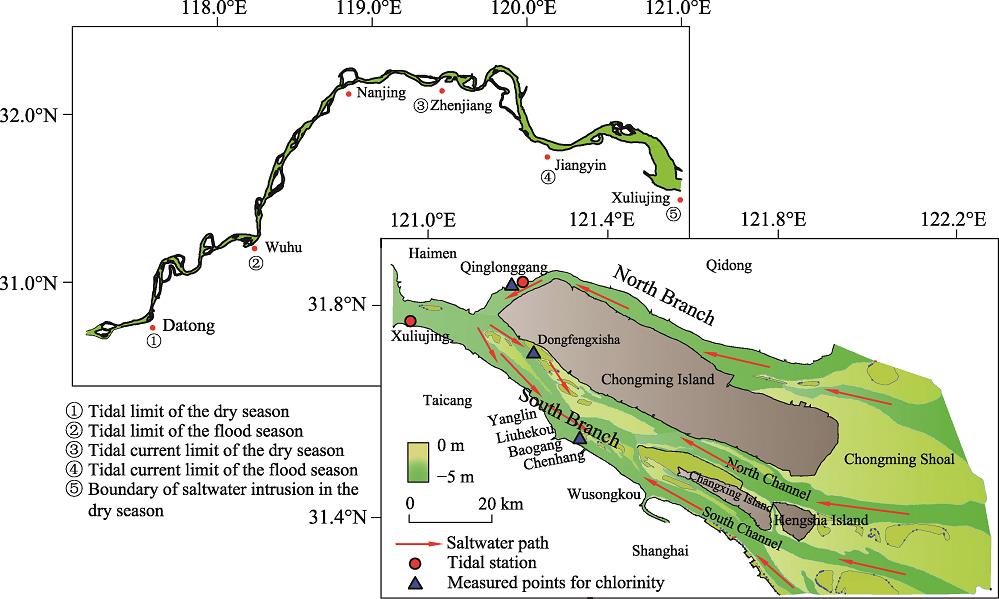
    Fig. 1. Sketch of the Yangtze River Estuary displaying the location of measuring stations
    Correlation between the daily mean tidal ranges of Xuliujing and Qinglonggang stations
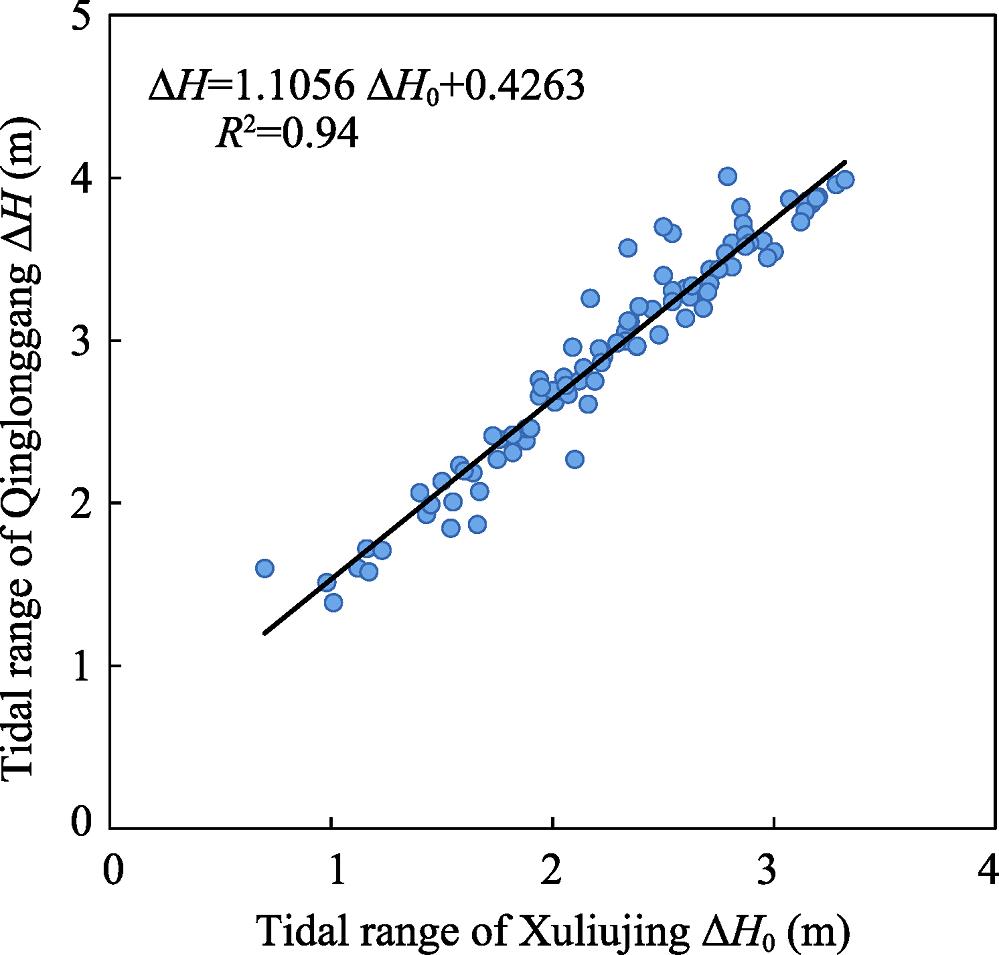
    Fig. 2. Correlation between the daily mean tidal ranges of Xuliujing and Qinglonggang stations
    Chlorinity of Dongfengxisha observation point, discharge at Datong station and tidal ranges at Xuliujing station in the dry seasons of 2009-2014
    Fig. 3. Chlorinity of Dongfengxisha observation point, discharge at Datong station and tidal ranges at Xuliujing station in the dry seasons of 2009-2014
    Relationship between the discharge at Datong station and the tidal range at Xuliujing station (Red line across the data points represents the trend line between the two variables.)
    Fig. 4. Relationship between the discharge at Datong station and the tidal range at Xuliujing station (Red line across the data points represents the trend line between the two variables.)
    Relationship between lunar calendar date and daily mean tidal range at (a) Xuliujing station and (b) Qinglonggang station (Curves of different colors represent different tidal range estimation modes.)
    Fig. 5. Relationship between lunar calendar date and daily mean tidal range at (a) Xuliujing station and (b) Qinglonggang station (Curves of different colors represent different tidal range estimation modes.)
    Characteristics of river discharge at Datong station in dry seasons of three different periods: (a) multi-year average monthly discharge; (b) the maximum and the minimum discharge in every month (Total height represents the maximum value of each month. Colored fill portion represents the minimum value of each month. Red represents the period of 1950-2002, brown represents the period of 2003-2007, blue represents the period of 2008-2017)
    Fig. 6. Characteristics of river discharge at Datong station in dry seasons of three different periods: (a) multi-year average monthly discharge; (b) the maximum and the minimum discharge in every month (Total height represents the maximum value of each month. Colored fill portion represents the minimum value of each month. Red represents the period of 1950-2002, brown represents the period of 2003-2007, blue represents the period of 2008-2017)
    Characteristics of saltwater intrusion under different river discharges: (a) relationship between daily discharge at Datong station and daily chlorinity at the Dongfengxisha observation point, (b) probability of chlorinity exceeding the drinking water standard in each discharge interval, and (c) the discharge at Datong station vs the cumulative probability of excessive chlorinity
    Fig. 7. Characteristics of saltwater intrusion under different river discharges: (a) relationship between daily discharge at Datong station and daily chlorinity at the Dongfengxisha observation point, (b) probability of chlorinity exceeding the drinking water standard in each discharge interval, and (c) the discharge at Datong station vs the cumulative probability of excessive chlorinity
    Tidal range of Xuliujing station vs chlorinity of Dongfengxisha observation point: (a) data of all discharges, and (b) data corresponding to the river discharge of approximately 11,000 m3/s
    Fig. 8. Tidal range of Xuliujing station vs chlorinity of Dongfengxisha observation point: (a) data of all discharges, and (b) data corresponding to the river discharge of approximately 11,000 m3/s
    Accumulative frequency of the tidal range of Xuliujing station
    Fig. 9. Accumulative frequency of the tidal range of Xuliujing station
    Comparison of the measured and calculated salinity values using different empirical models
    Fig. 10. Comparison of the measured and calculated salinity values using different empirical models
    Calculated chlorinity processes of the Dongfengxisha observation point under different river discharges (t denotes the duration when chlorinity exceeds the required drinking water standard)
    Fig. 11. Calculated chlorinity processes of the Dongfengxisha observation point under different river discharges (t denotes the duration when chlorinity exceeds the required drinking water standard)
    Data typeStationPeriodSource
    Daily dischargeDatong1950-2017Yangtze River Hydrographic Yearbook
    Daily mean tidal rangeXuliujing2009, 2011-2014Yangtze River Hydrographic Yearbook
    Daily mean tidal rangeQinglonggangCertain months in 2005, 2009, 2011, 2014 and 2017Jiangsu Provincial Hydrology and Water Resources Bureau, Zheng et al. (2014)
    Daily mean chlorinityDongfengxisha2009-2014Shanghai Water Affairs Bureau
    Table 1.

    Data sources

    SourceRelationshipVariable explanation
    Mao et al.(1993)S~exp(ΔHα/Qβ)S is the salinity of Baogang; ∆H is the tidal range of Qinglonggang; Q is the discharge at Datong station.
    Zheng et al.(2014)S=aebΔH+ aebΔH(c1Q3+ c2Q2+c3Q+c4)S is the salinity of Qinglonggang station; ∆H is the tidal range of Qinglonggang station; Q is the discharge at Datong station.
    Chen et al.(2013b)S=(4.16×10⁹Q22.745Q+4.317)×0.02404×e0.009085ΔHS is the salinity of Chenhang; ∆H is the tidal range of Qinglonggang station; Q is the discharge at Datong station.
    Sun et al.(2017)C=Aexp(aΔH0‒bQ)ΔH0 is the tidal range of Xuliujing station; Q is the discharge at Datong station; C is the chlorinity of Dongfengxisha.
    Table 2.

    Selected empirical models for salinity prediction in the upper South Branch of the Yangtze River Estuary

    Measured timeCumulative frequency of less than a certain value of discharge (%)
    < 25000 m3/s< 15000 m3/s< 12000 m3/s< 10000 m3/s
    1950-200245.7125.7116.910.06
    2003-200755.8324.8514.292.74
    2008-201750.3321.597.730.1
    Table 3.

    Frequency of daily discharge at Datong station in different periods

    Measured timeObservation pointSalinity excessive days (d)Average discharge at Datong station during the salinity excessive periods (m³/s)Data source
    Winter of 1978-Spring of 1979Wusong647256Shen et al.(2002)
    February-March 1987Chenhang138467Gu et al.(2003), Chen et al.(2011), Xu and Yuan(1994)
    February-March 1999259487Shen et al.(2002), Gu et al.(2003)
    February 20049.89479He et al.(2006)
    October 2006914,300Zhu et al.(2010)
    February 20141910,900Wang (2016)
    November 3-12, 2009Dongfengxisha1014,030Shanghai Water Affairs Bureau
    November 15-24, 20131012,240
    December 3-11, 2013912,500
    December 17-25, 2013911,365
    January 2-10, 2014912,144
    January 30-February 22, 20142411,138
    Table 4.

    Statistical features of certain saltwater intrusion events in the upper South Branch of the Yangtze River Estuary in recent decades

    Chlorinity of Dongfengxisha observation point (mg/L)Discharge at Datong station Qc (m³/s)Daily tidal range of Xuliujing station ∆Hc (m)
    25011,0002.05
    25012,0002.24
    25013,0002.42
    25015,0002.61
    Table 5.

    Corresponding tidal ranges of Xuliujing station (∆Hc) and discharges of Datong station (Qc) to maintain the drinking water standard

    Empirical salinity prediction modelTidal range estimation modeDetermination coefficient R2Tidal range estimation modeDetermination coefficient R2
    Mao et al. (1993)Qinglonggang station, curve B0.45Qinglonggang station, curve C0.51
    Zheng et al. (2014)Qinglonggang station, curve B0.85Qinglonggangstation, curve C0.88
    Chen et al. (2013b)Qinglonggang station, curve B0.7Qinglonggang station, curve C0.74
    Sun et al. (2017)Xuliujing station, curve B0.8Xuliujing station, curve C0.81
    Table 6.

    Determination coefficient between measured and calculated salinity using different tidal range estimation modes and different empirical salinity prediction models

    Empirical modelLocation of chlorinity predictionTidal range estimation modeCalculated critical discharge (m3/s)
    Mao et al. (1993)BaogangCurve C12,000
    Chen et al. (2013b)ChenhangCurve C11,000
    Sun et al. (2017)DongfengxishaCurve C11,500
    Table 7.

    Critical discharges calculated using different empirical models

    Zhaohua SUN, Jiewei FAN, Xin YAN, Cuisong XIE. Analysis of critical river discharge for saltwater intrusion control in the upper South Branch of the Yangtze River Estuary[J]. Journal of Geographical Sciences, 2020, 30(5): 823
    Download Citation