• Journal of Natural Resources
  • Vol. 35, Issue 12, 2888 (2020)
Dong-sheng ZHAN1, Qian-qian WU1, Jian-hui YU2、3、4、*, Wen-zhong ZHANG2、3、4, and Juan-feng ZHANG1
Author Affiliations
  • 1School of Management, Zhejiang University of Technology, Hangzhou 310023, China
  • 2Institute of Geographic Science and Natural Resources Research, CAS, Beijing 100101, China
  • 3Key Laboratory of Regional Sustainable Development Modeling, CAS, Beijing 100101, China
  • 4College of Resources and Environment, University of Chinese Academy of Sciences, Beijing 100049, China
  • show less
    DOI: 10.31497/zrzyxb.20201206 Cite this Article
    Dong-sheng ZHAN, Qian-qian WU, Jian-hui YU, Wen-zhong ZHANG, Juan-feng ZHANG. Spatiotemporal change and influencing factors of resource-based cities' housing prices in China[J]. Journal of Natural Resources, 2020, 35(12): 2888 Copy Citation Text show less
    Temporal change of resource-based cities' housing prices in China during 2011-2018
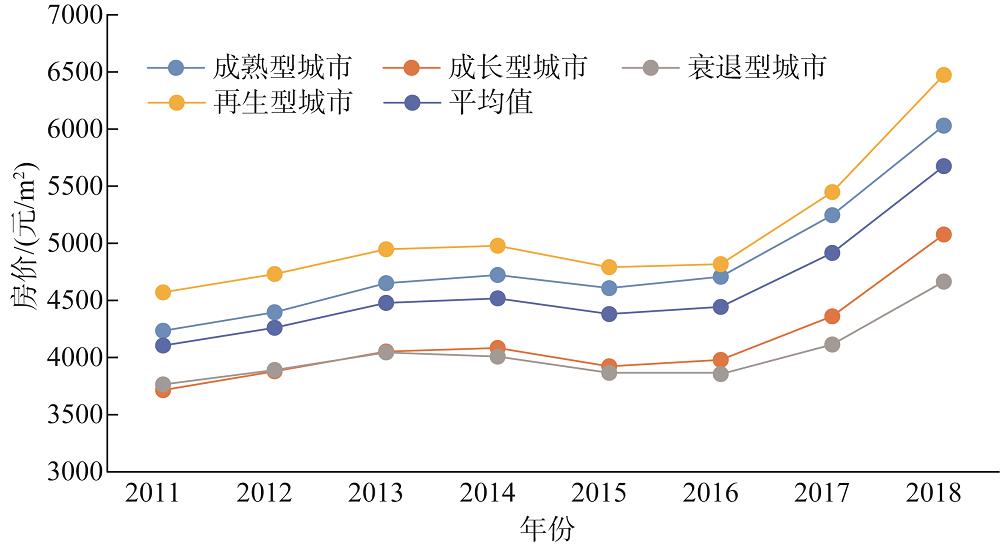
    Fig. 1. Temporal change of resource-based cities' housing prices in China during 2011-2018
    Spatial patterns of resource-based cities’ housing prices in China during 2011-2018
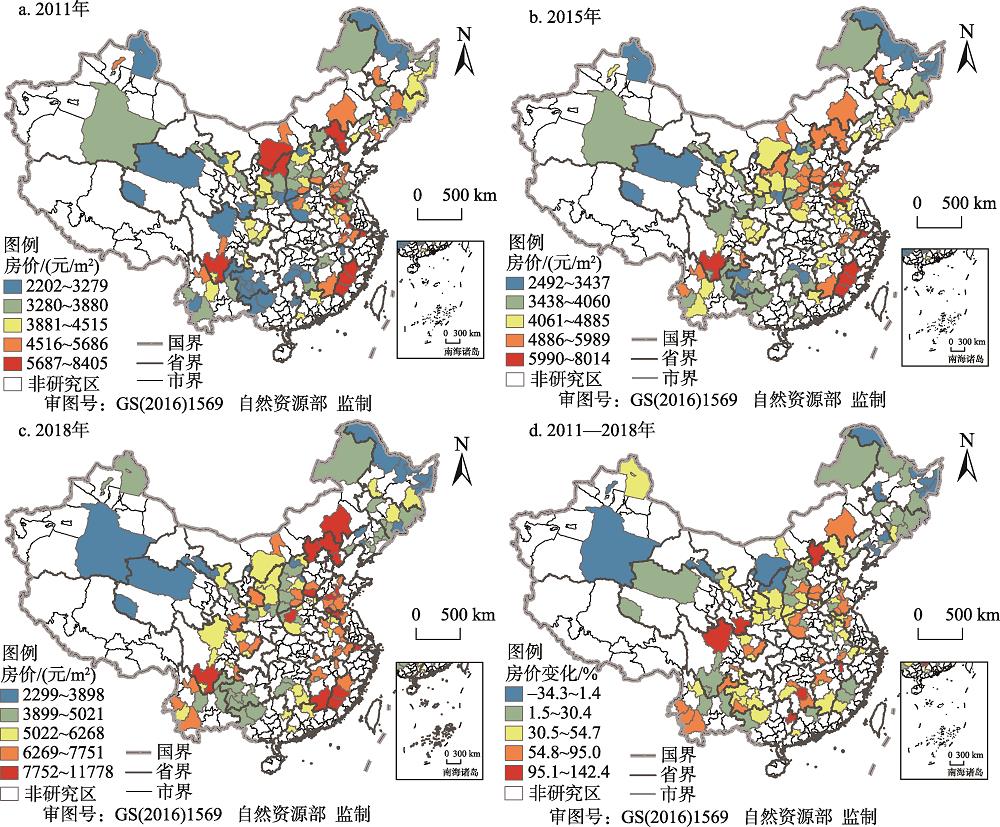
    Fig. 2. Spatial patterns of resource-based cities’ housing prices in China during 2011-2018
    Hot and cold spots spatial patterns of resource-based cities' housing prices in China during 2011-2018
    Fig. 3. Hot and cold spots spatial patterns of resource-based cities' housing prices in China during 2011-2018
    类型资源开发阶段资源保障能力社会经济发展
    成长型城市上升阶段潜力大后劲足
    成熟型城市稳定阶段水平较高
    衰退型城市趋于枯竭滞后
    再生型城市基本摆脱资源依赖步入良性发展轨道
    Table 1. Descriptive characteristics of different types of resource-based cities
    变量Moran's IZP
    2011年0.0853.23050.001
    2012年0.1144.21190.000
    2013年0.1194.30740.000
    2014年0.1334.71910.000
    2015年0.1655.84980.000
    2016年0.2067.39350.000
    2017年0.2469.11910.000
    2018年0.27310.08630.000
    2011—2018年变化值0.1638525.99500.000
    Table 2. Globe Moran's I of resource-based cities' housing prices and its change in China
    维度解释变量变量代码预期影响
    供给需求人口密度/(人/km2)PD+
    人均住房开发投资/元PHI-
    经济发展人均GDP/元PGDP+
    第三产业比例/%TIR+
    产业集聚采矿业专业化SI-
    多样化DI+
    人居环境每万人普通小学/个PRI+
    每万人医院数/个HOS+
    每万人拥有公共汽车/辆BUS+
    人均公园绿地面积/km2GA+
    建成区绿化率/%GR+
    环境污染单位GDP工业废水排放量/(t/万元)IW-
    单位GDP工业二氧化硫排放量/(t/亿元)SO2-
    单位GDP工业烟(粉)尘排放量/(t/亿元)IS-
    Table 3. Explanatory variables and their expected direction of resource-based cities' housing prices in China
    解释变量MaintWXt
    PD-0.0587-1.26-0.2430-1.13
    PHI0.0380**2.250.0882*1.92
    PGDP0.0570**2.260.06600.43
    TIR0.00040.26-0.0071-0.79
    SI-0.0081**-2.400.0613**2.05
    DI-0.0239*-1.80-0.1420*-1.67
    PRI0.00591.380.02781.50
    HOS0.00261.26-0.0219-1.01
    BUS0.00060.60-0.0234**-2.13
    GA0.00190.34-0.0028-0.15
    GR0.0001-0.200.0067**2.36
    IW-0.0018**-2.030.00070.07
    SO20.0000-0.170.00081.57
    IS0.00000.810.0000-0.22
    ρ (W×HP)0.498***Likelihood L1080.9237
    Table 4. Parameter estimate result of Spatial Durbin Model
    解释变量直接效应间接效应总效应
    系数P系数P系数P
    PD-0.05950.175-0.54400.276-0.60350.225
    PHI0.0413**0.0140.2270*0.0910.2683**0.042
    PGDP0.0583**0.0160.18300.5960.24130.487
    TIR0.00030.87-0.01520.469-0.01490.481
    SI-0.0068**0.0500.11600.1340.10920.161
    DI-0.0276**0.031-0.31700.115-0.3446*0.089
    PRI0.00660.1410.06400.1670.07060.135
    HOS0.00220.321-0.04100.419-0.03880.451
    BUS0.00020.853-0.0490*0.064-0.0488*0.071
    GA0.00220.693-0.00710.848-0.00490.893
    GR0.00010.9250.0139**0.0310.0140**0.036
    IW-0.0018*0.0810.00030.99-0.00150.925
    SO20.00000.9320.00160.140.00160.148
    IS0.00000.4580.00000.8590.00000.889
    Table 5. Direct and indirect effect estimates of explanatory variables
    Dong-sheng ZHAN, Qian-qian WU, Jian-hui YU, Wen-zhong ZHANG, Juan-feng ZHANG. Spatiotemporal change and influencing factors of resource-based cities' housing prices in China[J]. Journal of Natural Resources, 2020, 35(12): 2888
    Download Citation