• Advanced Photonics
  • Vol. 4, Issue 1, 016001 (2022)
Danran Li1、2, Nina Wang3, Tianyang Zhang3, Guangxing Wu1、2, Yifeng Xiong1、2, Qianqian Du4, Yunfei Tian1、2, Weiwei Zhao3, Jiandong Ye4, Shulin Gu4, Yanqing Lu1、2, Dechen Jiang3、*, and Fei Xu1、2、*
Author Affiliations
  • 1Nanjing University, College of Engineering and Applied Sciences, Nanjing, China
  • 2Nanjing University, National Laboratory of Solid State Microstructures, Collaborative Innovation Center of Advanced Microstructures, Nanjing, China
  • 3Nanjing University, School of Chemistry and Chemical Engineering, Nanjing, China
  • 4Nanjing University, School of Electronic Science and Engineering, Nanjing, China
  • show less
    DOI: 10.1117/1.AP.4.1.016001 Cite this Article Set citation alerts
    Danran Li, Nina Wang, Tianyang Zhang, Guangxing Wu, Yifeng Xiong, Qianqian Du, Yunfei Tian, Weiwei Zhao, Jiandong Ye, Shulin Gu, Yanqing Lu, Dechen Jiang, Fei Xu. Label-free fiber nanograting sensor for real-time in situ early monitoring of cellular apoptosis[J]. Advanced Photonics, 2022, 4(1): 016001 Copy Citation Text show less
    Schematic illustration and design of the fiber nanogratings sensor. (a) Schematic diagram of the ZnO nanogratings integrated on a fiber bioprobe. (b) SEM image of the fiber sensor, with a nanowire diameter of 800 nm. Scale bar, 1 μm. Inset, details of the nanogratings in the yellow dashed rectangle. (c) Microscope image of the fiber sensor with the nanogratings against a bright field. Scale bar, 10 μm. Inset, microscope image of the nanowire against a dark field, with incident light of 633 nm. Scale bar, 5 μm.
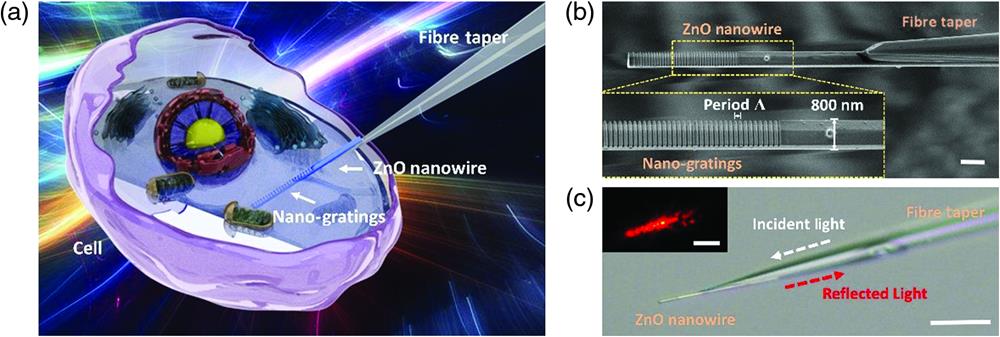
    Fig. 1. Schematic illustration and design of the fiber nanogratings sensor. (a) Schematic diagram of the ZnO nanogratings integrated on a fiber bioprobe. (b) SEM image of the fiber sensor, with a nanowire diameter of 800 nm. Scale bar, 1  μm. Inset, details of the nanogratings in the yellow dashed rectangle. (c) Microscope image of the fiber sensor with the nanogratings against a bright field. Scale bar, 10  μm. Inset, microscope image of the nanowire against a dark field, with incident light of 633 nm. Scale bar, 5  μm.
    Optical characteristics and RI sensitivity of the nanosensor. (a) Reflectance spectra of the fiber probe with (blue line) and without (black line) ZnO nanogratings. The peak wavelength is 658 nm. (b) Color map of spectra with different external RIs. (c) Shift in the peak reflection wavelength (black line) and the change in power at 655 nm (red line) as a function of the external RI. The red line is derived from the values in (b). (d) Dynamic response of the reflection power at 655 nm with the addition of ethanol (black line) and the power at 655 nm as a function of the external RI (red line). The figure closely coincides with the red line in (c).
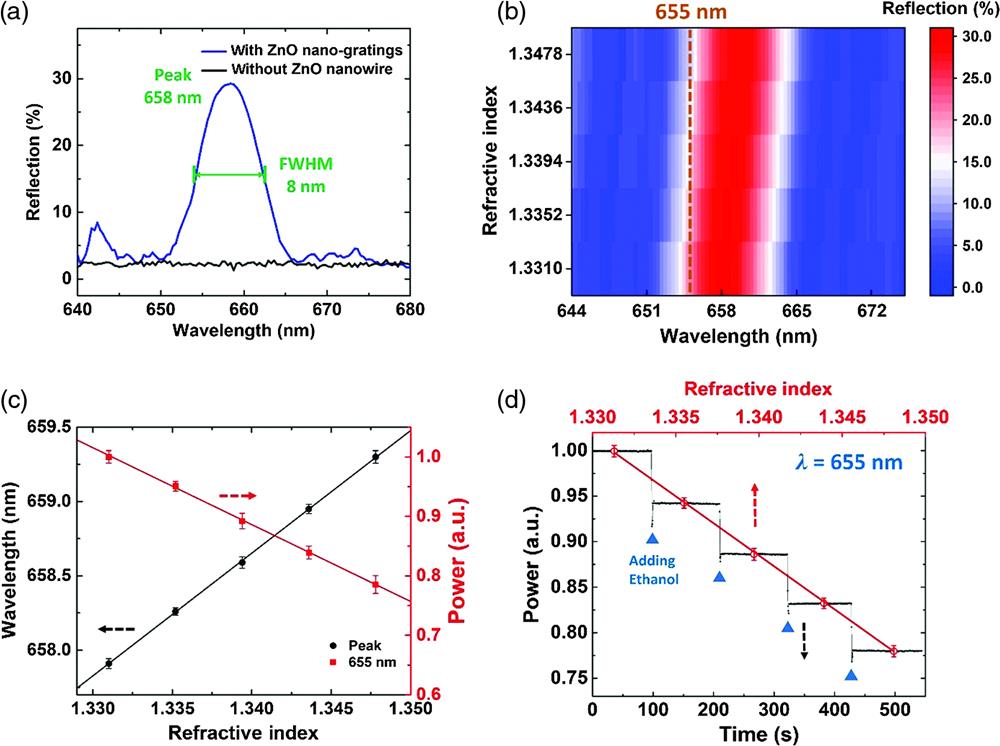
    Fig. 2. Optical characteristics and RI sensitivity of the nanosensor. (a) Reflectance spectra of the fiber probe with (blue line) and without (black line) ZnO nanogratings. The peak wavelength is 658 nm. (b) Color map of spectra with different external RIs. (c) Shift in the peak reflection wavelength (black line) and the change in power at 655 nm (red line) as a function of the external RI. The red line is derived from the values in (b). (d) Dynamic response of the reflection power at 655 nm with the addition of ethanol (black line) and the power at 655 nm as a function of the external RI (red line). The figure closely coincides with the red line in (c).
    Intracellular calibration and measurements of the nanosensor. (a) Schematic diagram of the experimental setup used to calibrate the RI sensitivity of the probe and measure the intracellular RI of HeLa cells. A low-power laser at 655 nm (∼800 nW) was injected into the pigtail of the fiber probe through port 2 of a visible circulator. The output light reflected at the nanogratings was transmitted through port 3 of the circulator, which was connected to an optical power meter to record the reflection power. Microscope and PL images of the tested cell (in red circle) and other reference cells. The tested cell was penetrated by a fiber probe with an ∼500 nm conical tip (b) and a ZnO nanograting-integrated fiber probe with an ∼800 nm tip (c). Scale bar, 40 μm. Microscope images of the ZnO nanowire-integrated fiber probe inserted into the (d) nucleus and (e) cytoplasm of single HeLa cells. Scale bar, 10 μm. (f) Normalized reflection power in the cytoplasm and nucleus of a single HeLa cell, indicating the difference in RI.
    Fig. 3. Intracellular calibration and measurements of the nanosensor. (a) Schematic diagram of the experimental setup used to calibrate the RI sensitivity of the probe and measure the intracellular RI of HeLa cells. A low-power laser at 655 nm (800  nW) was injected into the pigtail of the fiber probe through port 2 of a visible circulator. The output light reflected at the nanogratings was transmitted through port 3 of the circulator, which was connected to an optical power meter to record the reflection power. Microscope and PL images of the tested cell (in red circle) and other reference cells. The tested cell was penetrated by a fiber probe with an 500  nm conical tip (b) and a ZnO nanograting-integrated fiber probe with an 800  nm tip (c). Scale bar, 40  μm. Microscope images of the ZnO nanowire-integrated fiber probe inserted into the (d) nucleus and (e) cytoplasm of single HeLa cells. Scale bar, 10  μm. (f) Normalized reflection power in the cytoplasm and nucleus of a single HeLa cell, indicating the difference in RI.
    Real-time long-term early monitoring of HeLa cell apoptosis. Microscope images of single tested HeLa cells (yellow dashed circle) and other reference cells during the apoptosis process. (a) Immediately after the addition of H2O2, (b) 10 min after the addition of H2O2, (c) 30 min after the addition of H2O2, and (d) apoptotic cells 40 min after the addition of H2O2, scale bar, 20 μm. (e) Normalized reflection power in the nucleus of a single tested HeLa cell during apoptosis under the stimulation of H2O2 (black line), indicating a continuous increase in the nuclear RI. The numbers of pixels that the cell nucleus occupies in the microscope images (blue circle) roughly indicate the volume of the nucleus. Inset, PL images of living and apoptotic HeLa cells. Scale bar, 20 μm.
    Fig. 4. Real-time long-term early monitoring of HeLa cell apoptosis. Microscope images of single tested HeLa cells (yellow dashed circle) and other reference cells during the apoptosis process. (a) Immediately after the addition of H2O2, (b) 10 min after the addition of H2O2, (c) 30 min after the addition of H2O2, and (d) apoptotic cells 40 min after the addition of H2O2, scale bar, 20  μm. (e) Normalized reflection power in the nucleus of a single tested HeLa cell during apoptosis under the stimulation of H2O2 (black line), indicating a continuous increase in the nuclear RI. The numbers of pixels that the cell nucleus occupies in the microscope images (blue circle) roughly indicate the volume of the nucleus. Inset, PL images of living and apoptotic HeLa cells. Scale bar, 20  μm.
    Cell No.Decrease in power (ΔP1) in cytoplasm (%)RI in cytoplasmDecrease in power (ΔP2) in nucleus (%)RI in nucleus
    10.341.33487.411.3403
    20.691.33509.591.3420
    30.131.33465.621.3389
    40.251.33476.391.3395
    Table 1. RI measured in the cytoplasm and nucleus of four HeLa cells.
    Cell No.Decrease in power (ΔP2) in nucleus before apoptosis (%)Nuclear RI before apoptosisDecrease in power (ΔP3) in nucleus after apoptosis (%)Nuclear RI after apoptosis
    58.161.340813.891.3453
    66.921.339911.531.3435
    77.591.340511.921.3438
    Table 2. Measured RI of the nucleus in three apoptotic HeLa cells.
    Danran Li, Nina Wang, Tianyang Zhang, Guangxing Wu, Yifeng Xiong, Qianqian Du, Yunfei Tian, Weiwei Zhao, Jiandong Ye, Shulin Gu, Yanqing Lu, Dechen Jiang, Fei Xu. Label-free fiber nanograting sensor for real-time in situ early monitoring of cellular apoptosis[J]. Advanced Photonics, 2022, 4(1): 016001
    Download Citation