• Photonics Research
  • Vol. 9, Issue 7, 1384 (2021)
Hanmeng Li1、2、†, Xingjian Xiao1、2、†, Bin Fang1、2, Shenglun Gao1、2, Zhizhang Wang1、2, Chen Chen1、2, Yunwei Zhao1、2, Shining Zhu1、2, and Tao Li1、2、*
Author Affiliations
  • 1National Laboratory of Solid State Microstructures, Key Laboratory of Intelligent Optical Sensing and Manipulation, Jiangsu Key Laboratory of Artificial Functional Materials, College of Engineering and Applied Sciences, Nanjing University, Nanjing 210093, China
  • 2Collaborative Innovation Center of Advanced Microstructures, Nanjing 210093, China
  • show less
    DOI: 10.1364/PRJ.422280 Cite this Article Set citation alerts
    Hanmeng Li, Xingjian Xiao, Bin Fang, Shenglun Gao, Zhizhang Wang, Chen Chen, Yunwei Zhao, Shining Zhu, Tao Li. Bandpass-filter-integrated multiwavelength achromatic metalens[J]. Photonics Research, 2021, 9(7): 1384 Copy Citation Text show less
    (a) Flow chart of the Hooke–Jeeves (HJ) algorithm used to design our metalens. (b) The schematics of 12 kinds of meta-unit architectures, including nanopillars and their Babinet hollow structures. Our designed metalens is composed of these meta-units with varying in-plane geometrical parameters. (c) The comparison of the standard hyperbolic phase profile (black lines) and the calculated ones of metalens at the designed wavelengths: 610 nm (red dots), 540 nm (green dots), 490 nm (blue dots). The inset is a zoom-in image for clarification. (d) Simulated focusing intensity distributions of the designed multiwavelength achromatic metalens, which is designed with an NA=0.2 and a focal length of 735 μm in the x−z plane corresponding to 610 nm (red region), 540 nm (green region), and 490 nm (blue region) wavelengths from left to right, respectively. The white dashed line indicates the designed focal length. (e) Comparison of the focusing efficiency between the multiwavelength achromatic and the quasicontinuous band achromatic metalenses, which are shown in red squares and black bar charts, respectively.
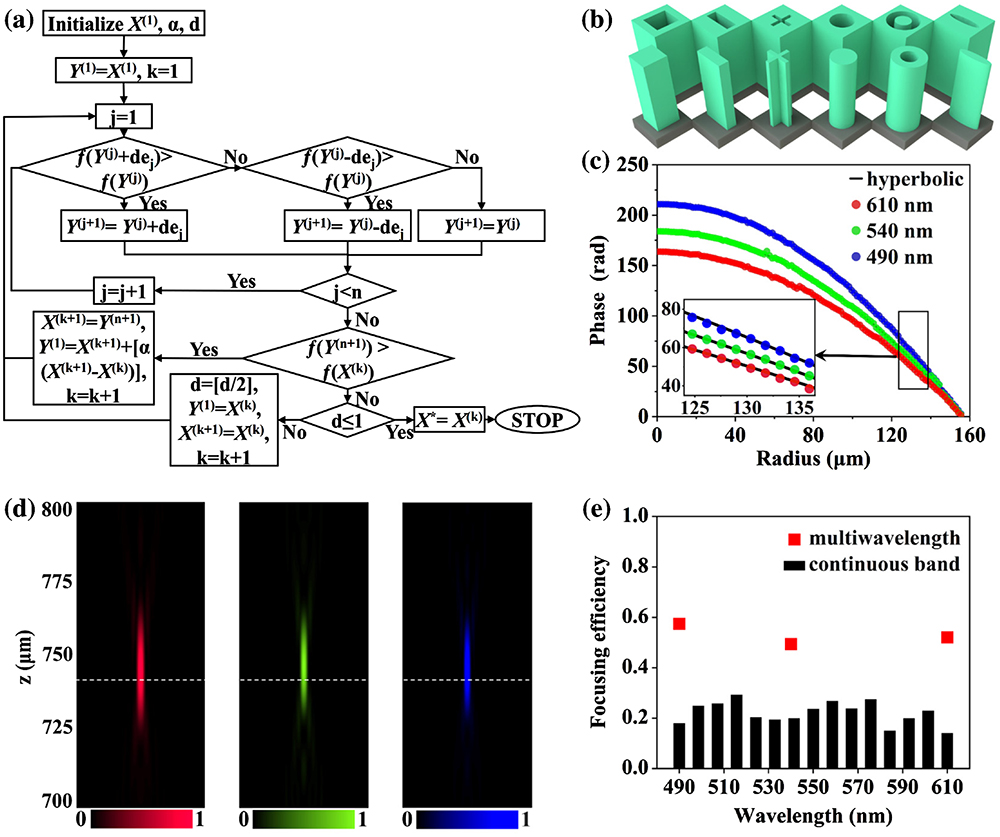
    Fig. 1. (a) Flow chart of the Hooke–Jeeves (HJ) algorithm used to design our metalens. (b) The schematics of 12 kinds of meta-unit architectures, including nanopillars and their Babinet hollow structures. Our designed metalens is composed of these meta-units with varying in-plane geometrical parameters. (c) The comparison of the standard hyperbolic phase profile (black lines) and the calculated ones of metalens at the designed wavelengths: 610 nm (red dots), 540 nm (green dots), 490 nm (blue dots). The inset is a zoom-in image for clarification. (d) Simulated focusing intensity distributions of the designed multiwavelength achromatic metalens, which is designed with an NA=0.2 and a focal length of 735 μm in the xz plane corresponding to 610 nm (red region), 540 nm (green region), and 490 nm (blue region) wavelengths from left to right, respectively. The white dashed line indicates the designed focal length. (e) Comparison of the focusing efficiency between the multiwavelength achromatic and the quasicontinuous band achromatic metalenses, which are shown in red squares and black bar charts, respectively.
    (a) Schematic illustration of the proposed bandpass filter, which is composed of multiple DBRs and several dielectric defect layers sandwiched between them. (b) Simulated transmission spectrum of the designed filter varied with the parameter d5. d5 denotes the varied coefficient of the thickness of the defect layer we selected. The white dashed line indicates the selected value of 4.33 for d5. (c) Simulated transmission spectrum of the filter with the configuration selected in (b) is plotted in black dashed line. The corresponding experimental results of the filter and the complete sample (filter-integrated multiwavelength achromatic metalens) are shown with the purple and red solid lines, respectively.
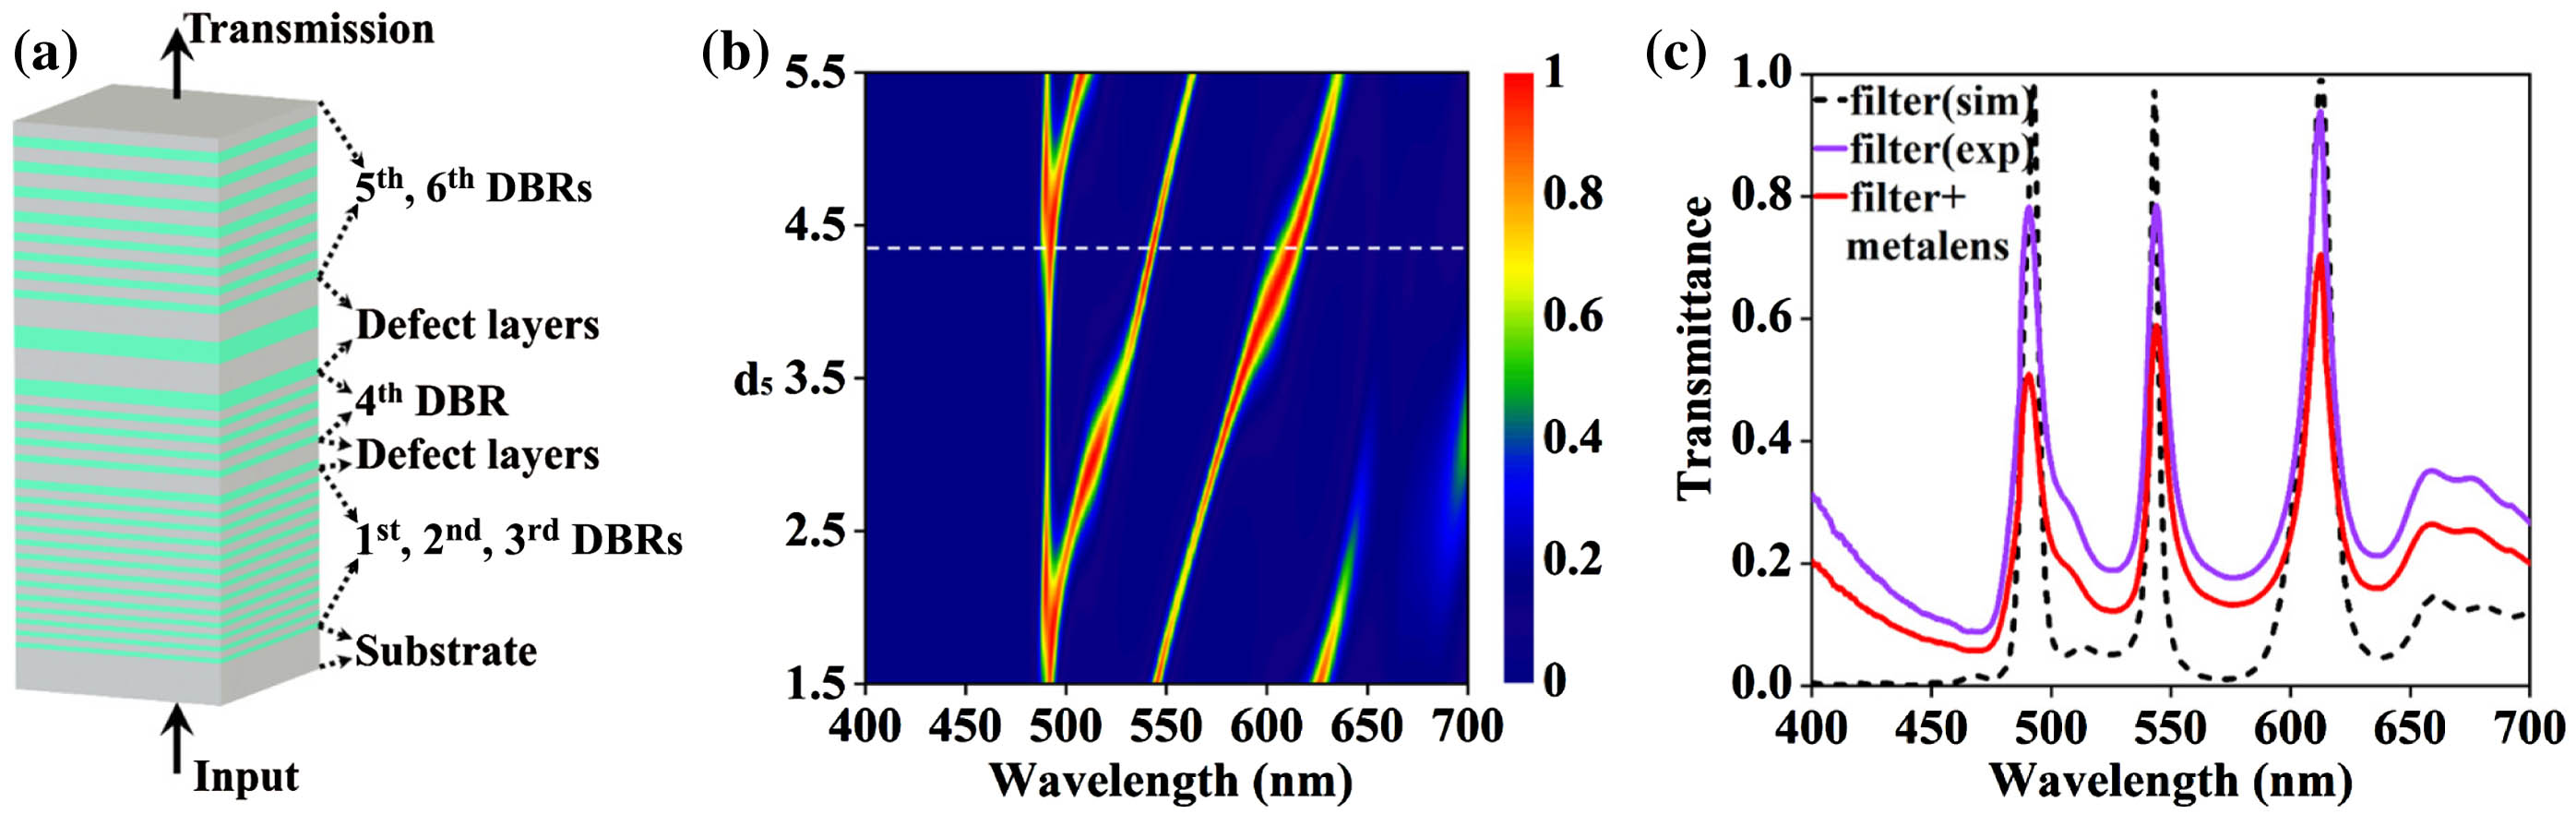
    Fig. 2. (a) Schematic illustration of the proposed bandpass filter, which is composed of multiple DBRs and several dielectric defect layers sandwiched between them. (b) Simulated transmission spectrum of the designed filter varied with the parameter d5. d5 denotes the varied coefficient of the thickness of the defect layer we selected. The white dashed line indicates the selected value of 4.33 for d5. (c) Simulated transmission spectrum of the filter with the configuration selected in (b) is plotted in black dashed line. The corresponding experimental results of the filter and the complete sample (filter-integrated multiwavelength achromatic metalens) are shown with the purple and red solid lines, respectively.
    (a) Optical image of the fabricated achromatic metalens with 0.2 NA and 300 μm diameter (scale bar is 50 μm) and the zoom-in SEM image shown in the right panel (scale bar is 1 μm). (b) Experimental longitudinal cross sections of the focusing light intensity by the filter-integrated multiwavelength achromatic metalens under additional filtered illuminations (10 nm bandwidth) at 610 nm (red region), 540 nm (green region), and 490 nm (blue region) wavelengths, respectively, above which is the normalized focal spots at the designed focal length of 735 μm. Scale bars are 2 μm. (c) Comparison of simulated and experimental normalized focusing intensity profiles for the three wavelengths. The Strehl ratios are shown in the respective panels.
    Fig. 3. (a) Optical image of the fabricated achromatic metalens with 0.2 NA and 300 μm diameter (scale bar is 50 μm) and the zoom-in SEM image shown in the right panel (scale bar is 1 μm). (b) Experimental longitudinal cross sections of the focusing light intensity by the filter-integrated multiwavelength achromatic metalens under additional filtered illuminations (10 nm bandwidth) at 610 nm (red region), 540 nm (green region), and 490 nm (blue region) wavelengths, respectively, above which is the normalized focal spots at the designed focal length of 735 μm. Scale bars  are  2  μm. (c) Comparison of simulated and experimental normalized focusing intensity profiles for the three wavelengths. The Strehl ratios are shown in the respective panels.
    (a)–(c) Imaging results with the filter-integrated multiwavelength achromatic metalens under additional filtered illuminations (10 nm bandwidth) at 610 nm (red region), 540 nm (green region), and 490 nm (blue region) wavelengths, respectively. (d) and (e) The experiment captured white light images (without additional filters) for the cases of the filter-integrated multiwavelength achromatic metalens and that without the bandpass filter, respectively. The imaging target is a standard USAF resolution chart. Scale bars are 10 μm. (f) and (g) Experimentally obtained longitudinal cross sections of the focusing light intensity in the x−z plane under a white light illumination for the cases of the filter-integrated multiwavelength achromatic metalens and that without the bandpass filter, respectively.
    Fig. 4. (a)–(c) Imaging results with the filter-integrated multiwavelength achromatic metalens under additional filtered illuminations (10 nm bandwidth) at 610 nm (red region), 540 nm (green region), and 490 nm (blue region) wavelengths, respectively. (d) and (e) The experiment captured white light images (without additional filters) for the cases of the filter-integrated multiwavelength achromatic metalens and that without the bandpass filter, respectively. The imaging target is a standard USAF resolution chart. Scale bars  are  10  μm. (f) and (g) Experimentally obtained longitudinal cross sections of the focusing light intensity in the xz plane under a white light illumination for the cases of the filter-integrated multiwavelength achromatic metalens and that without the bandpass filter, respectively.
    Hanmeng Li, Xingjian Xiao, Bin Fang, Shenglun Gao, Zhizhang Wang, Chen Chen, Yunwei Zhao, Shining Zhu, Tao Li. Bandpass-filter-integrated multiwavelength achromatic metalens[J]. Photonics Research, 2021, 9(7): 1384
    Download Citation