• Journal of Resources and Ecology
  • Vol. 11, Issue 3, 253 (2020)
Ben NIU1, Yongtao HE1、2, Xianzhou ZHANG1、2、*, Peili SHI1、2, and Mingyuan DU3
Author Affiliations
  • 1Lhasa Plateau Ecosystem Research Station, Key Laboratory of Ecosystem Network Observation and Modeling, Institute of Geographic Sciences and Natural Resources Research, Chinese Academy of Sciences, Beijing 100101, China
  • 2College of Resources and Environment, University of Chinese Academy of Sciences, Beijing 100190, China
  • 3Institute for Agro-Environmental Sciences, National Agriculture and Food Research Organization, Ibaraki 305-8604, Japan
  • show less
    DOI: 10.5814/j.issn.1674-764X.2020.03.002 Cite this Article
    Ben NIU, Yongtao HE, Xianzhou ZHANG, Peili SHI, Mingyuan DU. Satellite-based Estimates of Canopy Photosynthetic Parameters for an Alpine Meadow in Northern[J]. Journal of Resources and Ecology, 2020, 11(3): 253 Copy Citation Text show less

    Abstract

    Plant photosynthesis is the fundamental driver of all the biospheric functions. Alpine meadow on the Tibetan Plateau is sensitive to rapid climate change, and thus can be considered an indicator for the response of terrestrial ecosystems to climate change. However, seasonal variations in photosynthetic parameters, including the fraction of photosynthetically active radiation by canopy (FPAR), the light extinction coefficient (k) through canopy, and the leaf area index (LAI) of plant communities, are not known for alpine meadows on the Tibetan Plateau. In this study, we used field measurements of radiation components and canopy structure from 2009 to 2011 at a typical alpine meadow on the northern Tibetan Plateau to calculate these three photosynthetic parameters. We developed a satellite-based (NDVI and EVI) method derived from the Beer-Lambert law to estimate the seasonal dynamics of FPAR, k ,and LAI, and we compared these estimates with the Moderate Resolution Imaging Spectroradiometer (MODIS) FPAR (FPAR_MOD) and LAI product (LAI_MOD). The results showed that the average daily FPAR was 0.33, 0.37 and 0.35, respectively, from 2009 to 2011, and that the temporal variations could be explained by all four satellite-based FPAR estimations, including FPAR_MOD, an FPAR estimation derived from the Beer-Lambert law with a constant k (FPAR_LAI), and two FPAR estimations from the nonlinear functions between the ground measurements of FPAR (FAPRg) and NDVI/EVI (FPAR_NDVI and FPAR_EVI). We found that FPAR_MOD seriously undervalued FPARg by over 40%. Tower-based FPAR_LAI also significantly underestimated FPARg by approximately 20% due to the constant k (0.5) throughout the whole growing seasons. This indicated that using FPAR_LAI to validate the FPAR_MOD was not an appropriate method in this alpine meadow because the seasonal variation of k ranged from 0.19 to 2.95 in this alpine meadow. Thus, if the seasonal variation of k was taken into consideration, both FPAR_NDVI and FPAR_EVI provided better descriptions, with negligible overestimates of less than 5% of FAPRg (RMSE=0.05), in FPARg estimations than FPAR_MOD and FPAR_LAI. Combining the satellite-based (NDVI and EVI) estimations of seasonal FPAR and k, LAI_NDVI and LAI_EVI derived from the Beer-Lambert law also provided better LAIg estimations than LAI_MOD (less than 30% of LAIg). Therefore, this study concluded that satellite-based models derived from the Beer-Lambert law were a simple and efficient method for estimating the seasonal dynamics of FPAR, k and LAI in this alpine meadow.

    1 Introduction

    Alpine meadow ecosystems on the Qinghai-Tibetan Plateau, one of the largest soil carbon pools with 11.3 Pg C in China, has a soil carbon density of 18.2 Kg m-2 (Ni, 2002; Saito et al., 2009). Compared to other terrestrial ecosystems, fragile alpine meadows are among the most sensitive ecosystems to climate change (Saito et al., 2009; Chen et al., 2013; Piao et al., 2019). The alpine ecosystems on the plateau undergo large diurnal and seasonal variabilities in climate conditions, in extreme cases, even experiencing “four seasons” in a single day (Chen et al., 2009). Alpine grasslands are the most common landscape on the Qinghai-Tibetan Plateau, covering approximately 20% (2.5×10⁶ km2) of the area of the plateau (Zheng et al., 2000). Understanding canopy structure and carbon capture capability (photosynthesis) are necessary to determine the contribution alpine meadows make to regional and global carbon cycles (Li and Fang, 1999; Zhao et al., 2006).

    Plant-driven photosynthesis, usually quantified as gross primary production (GPP), is the basis of all the terrestrial biospheric functions (Gitelson et al., 2006), and represents the productive capacity of ecosystems (Running et al., 2000). Leaf area index (LAI) is used for quantifying vegetation canopy structure (Behera et al., 2010), and plays a significant role in many ecological and hydrological models for simulating water and carbon cycles (Weiss et al., 2004; Cao et al., 2015). For example, the fraction of photosynthetically active radiation (PAR, solar radiation in the 400-700 nm wavebands) by canopy (FPAR) is one critical input parameter of models used to estimate GPP estimations models. FPAR can be estimated indirectly from LAI measurements following the Beer-Lambert law (Ruimy et al., 1999). However, direct measurements of LAI are time- and labor-intensive for small canopies. In harsh environments like those found in Tibetan alpine meadows, it is virtually impossible to undertake ongoing observations over the long term.

    Remote sensing data can overcome the space and time limitations that hinder the obtaining of field measurements (de Almeida et al., 2018), and thus can capture consistent, continuous observations of vegetation structure (Niu et al., 2017c; Xiao et al., 2019). For example, satellite products obtained from the Moderate Resolution Imaging Spectroradiometer (MODIS), such as LAI_MOD and FPAR_MOD (Collection 6), are capable of revealing vegetation canopy structure and seasonal variations across the globe. Consequently, numerous models based on the light use efficiency (LUE) theory and driven by satellite data have been developed to estimate GPP (Running et al., 2000; Xiao et al., 2004; Yan et al., 2009; Tang et al., 2015; Niu et al., 2016; Niu et al., 2017b). Among these are the MOD17 algorithm (MOD) (Running et al., 2000; Heinsch et al., 2003), the vegetation photosynthesis model (VPM) (Xiao et al., 2004; Xiao al., 2005), and the photosynthetic capacity model (PCM) (Gao et al., 2014). In these satellite-based models, FPAR is indirectly derived from the Beer-Lambert law based on the linear relationship between LAI measurements and LAI_MOD (Rossini et al., 2012; Dong et al., 2015; Niu et al., 2016; Niu et al., 2017b) or from statistical inferences using paired comparisons with eddy covariance-based GPP estimations (Gao et al., 2014; Niu et al., 2017c). Thus, it is difficult to determine whether the FPAR value is correct, because many site-specific factors, such as vegetation types, phenology, and environmental stresses, can affect the accuracy of FPAR measurements (Heinsch et al., 2003; Tang et al., 2015; Wagle et al., 2016; Fu and Wu, 2017). Moreover, the light extinction coefficient (k), a key parameter in the Beer-Lambert law, is always set to a constant of 0.5 for herbaceous crops in most study areas (Varlet-Grancher et al., 1980; Fu et al., 2012), and this can result in estimation errors because k also has site-specific seasonal trends (Wang et al., 2004; Saitoh et al., 2012). Of course, it is also possible that a series of inaccurate parameters produces an accurate estimate result. Alternatively, radiation transfer models using simple measurements of radiation components can provide a useful way to accurately estimate LAI and corresponding parameters (Behera et al., 2010; Yang et al., 2015). This is because solar radiation is a driver of biological activities, and plant canopies interact in various canopy structure-dependent ways with solar radiation (Chen et al., 1997). Therefore, site-specific photosynthetic parameters, FPAR, k and LAI, estimations based on tower-based radiation measurements are always necessary, not only for accurate GPP estimations, but to validate model parameters in alpine meadow ecosystems.

    In this study, we selected a typical alpine steppe―a Korbresia meadow on the northern Tibetan Plateau, as our study site. At this site, we: 1) quantified site-specific photosynthetic parameters, FPAR, k and LAI, using tower-based plants and meteorological measurements from 2009 to 2011; 2) evaluated the deviation of satellite-based FPAR estimations from corresponding field measurements; 3) and used available satellite-based products to develop models to estimate and validate photosynthetic parameters in this alpine swamp meadow.

    2 Materials and methods

    2.1 Site description

    The study site is a typical alpine steppe—Korbresia meadow, located at the Damxung grassland station (30.49783°N, 91.06636°E, elevation 4333 m), a long-term position monitoring station of the Chinese Academy of Sciences on the northern Tibetan Plateau (Shi et al., 2006; Niu et al., 2017b). The site has a plateau monsoon climate, and is characterized by intensive radiation (annual mean sunlight and solar radiations are 2880.9 h and 7527.6 MJ m-2, respectively), low air temperatures (annual mean temperature is 1.8 ℃), and short cool summers. Average annual precipitation, over half of which occurs in July and August, is 476.6 mm (Niu et al., 2017a). The alpine meadow’s vegetation is dominated by three species: Stipa capillacea, Carex montis-everestii and Kobresia pygmaea, and total coverage is 50% to 80%. During the study period from 2009 to 2011, the frozen period (Ts 【-逻*辑*与-】lt; 0 ℃) was from November to March. Vegetation began to green-up at the beginning of May, and thus, we set the growing season as beginning on or around 1 May (the 121st day of year, DOY 121) and continuing to mid-October (DOY 281) (Niu et al., 2017b).

    2.2 Ground meteorological and plant measurements

    Ground meteorological measurements include air temperature at the height of 2 m (Ta), precipitation (PPT), relative humidity, vapor pressure deficit (VPD), soil temperature at a depth of 5 cm (Ts), and soil water content (SWC). Tower-based radiation measurements include observations of standard radiation observations and sub-spectra radiation (photosynthetically active radiation, with wavelengths of 380-710 nm). Standard radiation observations include four radiative components: solar shortwave down-welling radiation (Rt), shortwave up-welling radiation from land surface reflection (Rr), longwave down-welling radiation (Ri), and longwave up-welling radiation (Rl). Thus, the net radiant energy (Rn) was obtained from equation (1) (Baldocchi et al., 1984).

    Rn=Rt-Rr+Ri-Rl

    The sub-spectra radiation observations consist of incident photosynthetically active radiation above the canopy (PAR) and the absorbed PAR by canopy (APAR), which is the difference between PAR and the sum of canopy-reflected PARr (PARreflect), and the understory PARu (PARunder) from two of the same sensors (Eq. 2). Thus, the fraction of absorbed PAR by vegetation canopy (FPARg) can be directly calculated using the ratio between APAR and PAR (Eq. 3).

    APAR=PAR-(PARr+PARu)
    FPAPg=APAP/PAR

    In this study, the units of all radiation components were converted to MJ m-2 in order to make pairwise comparisons (Xu et al., 2007). All measurements were recorded in a data-logger once every 30 mins. We also established five identical sampling plots, each with one sampling quadrat (0.5 m×0.5 m), along an almost 2-km-long sample line. Aboveground parts of plants were clipped by species to ground level, and we then measured the vegetation leaf area index (LAIg) of the plant communities every two weeks during the growing season.

    2.3 Satellite-based measurements

    Using the study site position as the center pixel, we extracted MODIS 8-day surface reflectance composite data (MOD09A1) and MODIS LAI/FPAR (LAI_MOD/FPAR_ MOD) data for the years 2009 to 2011 from the Land Processes DAAC (http://daac.ornl.gov/MODIS). Based on MOD09A1, we calculated two vegetation indices (NDVI and EVI) using Eq. 4 and Eq. 5, and a Land Surface Water Index (LSWI) using Eq.6 (Xiao et al., 2005; Yan et al., 2009; Dong et al., 2015).

    $NDVI=\frac{{{\rho }_{\text{nir}}}-{{\rho }_{\text{red}}}}{{{\rho }_{\text{nir}}}+{{\rho }_{\text{red}}}}$
    $EVI=\frac{2.5\times ({{\rho }_{\text{nir}}}-{{\rho }_{\text{red}}})}{({{\rho }_{\text{nir}}}+6\times {{\rho }_{\text{red}}}-7.5\times {{\rho }_{\text{blue}}}+1)}$
    $LSWI=\frac{{{\rho }_{\text{nir}}}-{{\rho }_{\text{swir}}}}{{{\rho }_{\text{nir}}}+{{\rho }_{\text{swir}}}}$

    where ${{\rho }_{\text{nir}}}$(841-876 nm), ${{\rho }_{\text{red}}}$(620-670 nm), ${{\rho }_{\text{blue}}}$(459- 479 nm), and ${{\rho }_{\text{swir}}}$(459-479 nm) are the four surface reflectance values from different spectral bands.

    2.4 Satellite-based FPAR estimations

    Except for ground tower-based FPARg, and MODIS FPAR products (FPAR_MOD), FPAR can also be derived from LAIg observations based on the Beer-Lambert law (Ruimy et al., 1999) (Eq. 7):

    $FPAR\_LAI=0.95\times (1-{{e}^{(-\text{k}\times LAImg)}})$

    where k is the light extinction coefficient with a value of 0.5 for herbaceous crops (Varlet-Grancher et al., 1980; Fu et al., 2012). The LAImg is a linear regression conversion between ground LAI measurements and MOD15A2 for consecutive measurements once every 8 days during the study period (Niu et al., 2016). In this study, FPARg was observed in tower-based radiation components, meaning that we can estimate the actual extinction coefficient (kt) using a modified version of the Beer-Lambert law (Eq. 7) as follows (Eq. 8):

    $kt=\frac{-\ln (1-FPARg/0.95)}{LAImg}$

    Using the relationships between FPARg, kt and three satellite-based measurements (NDVI, EVI, and LSWI), we developed satellite-based statistical models to estimate FPAR and kt (FPARs and kts). These models could be used to directly estimate the LAI (LAIs) with the modified version of the Beer-Lambert law as follows (Eq. 9):

    $LAIs=\frac{-\ln (1-FPARs/0.95)}{kts}$

    2.5 Statistical analysis

    In this study, we reconciled the ground measurements to the 8-day time step as MODIS products were, because we assumed the plants conditions in each 8-day interval were the same (Fu et al., 2012; Gao et al., 2015; Niu et al., 2017b). Daily scale gaps of climate data and vegetation indices were linear or cubic interpolations in days of the year (DOYs). The normality (Shapiro-Wilk test) and homogeneity of variance test (Bartlett test) (P 【-逻*辑*与-】gt; 0.05) were performed in daily and integrated growing season FAPR estimations. We then employed a one-way analysis of variance (ANOVA) and Tukey’s honest significant difference (HSD) to investigate the performance of different models for FPAR estimations at α=0.05. Additionally, a linear regression analysis and two indices, RMSE and RPE (Eq. 10 and Eq. 11), were used to evaluate the model agreement and bias from FPARg.

    $RMSE=\sqrt{\frac{\sum\limits_{i=1}^{n}{{{({{x}_{i}}-{{y}_{i}})}^{2}}}}{n}}$
    $RPE=\left( \frac{\bar{y}-\bar{x}}{{\bar{y}}} \right)\times 100\% $

    where xi, $\bar{x}$, yi and $\bar{y}$ represent, respectively, the satellite-based FPAR estimations, the mean value of satellite-based FPAR estimations, the FPARg time series, and the mean value of FPARg. All statistical and modeling procedures were performed in the R statistical computing package (v3.5.1).

    3 Results

    3.1 Tower-based radiation measurements

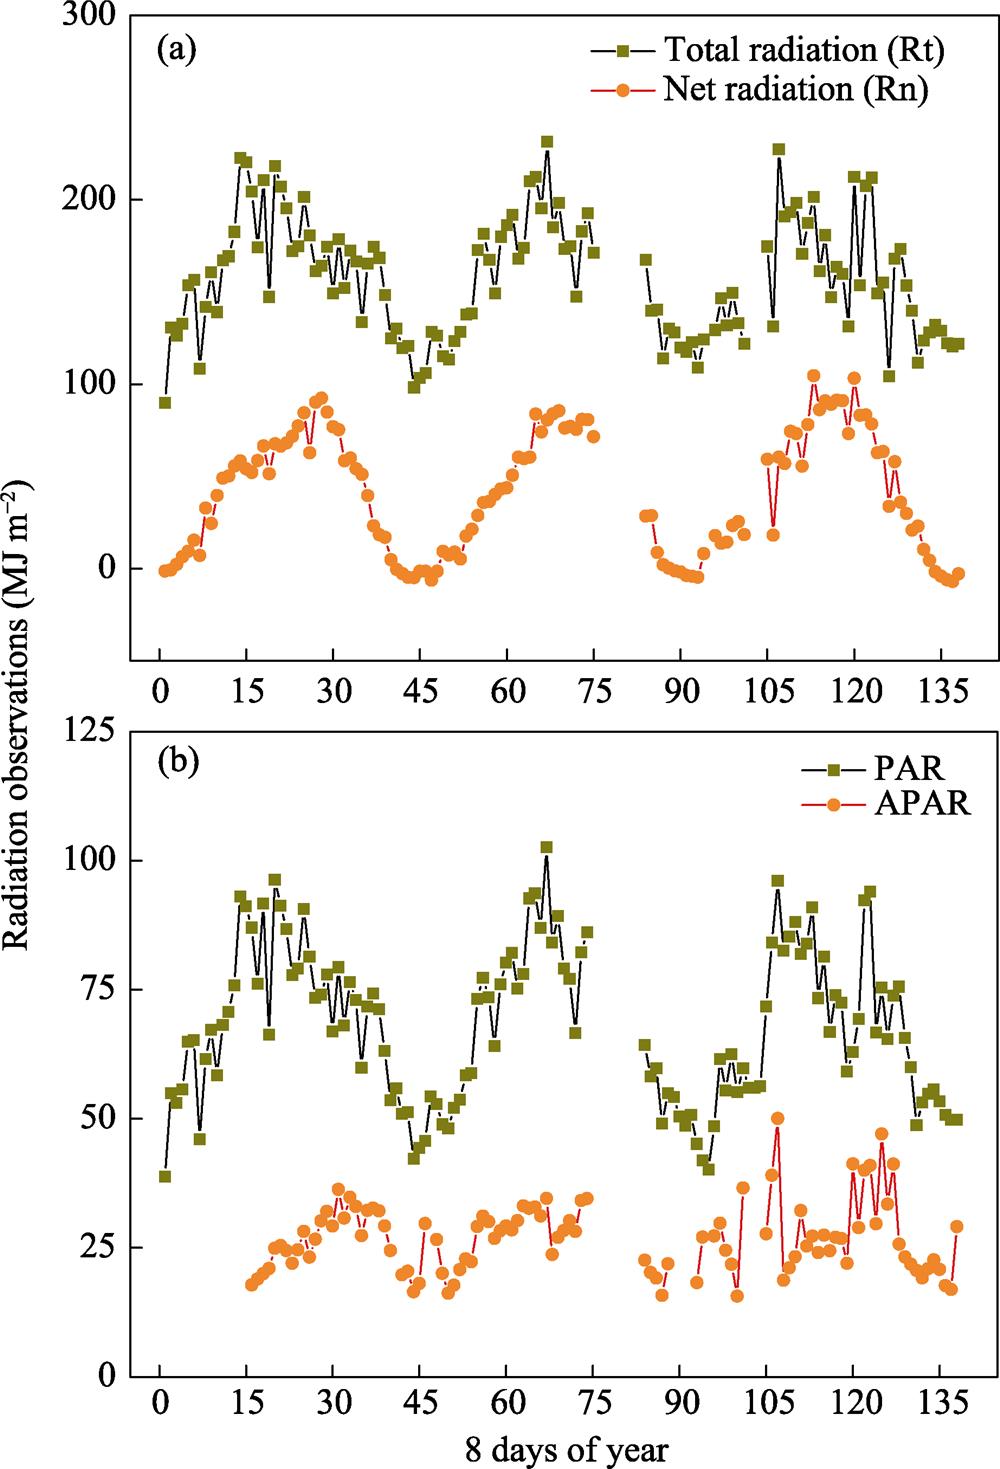
    Seasonal variations of all radiation components, including total radiation (Rt), net radiation (Rn), PAR and APAR, showed consistent and single peak patterns in each year from 2009 to 2011 (Fig. 1). However, the magnitude of seasonal variations and the date of the peaks were different among the four radiation components. The seasonal Rt variation was the most robust from 2009 to 2011 with an average of 19.66 (±4.07, standard deviation (SD), and 20.7 % of the coefficient of variation (CV)) MJ m-1 day-1 (Fig. 1a). Net radiation accounted for 26.2 % of total radiation (5.16 MJ m-1 day-1), but the CV was the most significant (79.2%, SD=7.72 MJ m-1 day-1), indicating seasonal variations of Rn were the most conspicuous (Fig. 1). The PAR was 43.4 % of total radiation (8.53 MJ m-1 day-1), of which 39.5% was absorbed by the canopy (3.37 MJ m-1 day-1, mean value of APAR). The CVs of both PAR and APAR were both approximately 20%, close to that of Rt (Fig. 1b).

    The peak value of Rt (DOY 150-160) and PAR (DOY 150-160) occurred earlier than those of Rn (DOY 210-230) and APAR (DOY 250-260) (Fig. 1). The inter-annual variations of all radiation components were weak from 2009 to 2011. Specifically, the CV of the inter-annual Rn variation was 8.4%, while those of the other three radiation components were less than 3.0 %. By comparison, Rt and PAR were more significant in 2009, while Rn and APAR were higher in 2011 than the other years (Fig. 1).

    The 8-day step radiation observations during the years 2009 to 2011. (a) Total radiation and net radiation. (b) Photosynthetically active radiation (PAR) and the absorbed PAR by canopy (APAR).

    Figure 1.The 8-day step radiation observations during the years 2009 to 2011. (a) Total radiation and net radiation. (b) Photosynthetically active radiation (PAR) and the absorbed PAR by canopy (APAR).

    3.2 Comparison of FPAR estimations

    The seasonal dynamics of satellite-based FPAR estimations, FPAR_MOD and FAPR_LAI, corresponded well with the observed FPARg from 2009 to 2011 (Fig. 2a). The peak of FPAR generally appeared between mid-August and the beginning of September (DOY 225-255), had values that could exceed 0.5 (Fig. 2a). FPAR_MOD and FAPR_LAI captured more than 57% of FPARg patterns in the alpine meadow study area (R2【-逻*辑*与-】gt;0.57, P【-逻*辑*与-】lt;0.0001, Figs. 2b-2d). With respect to the results of individual years, satellite-based FPAR estimations provided a better description (with larger R2) for seasonal dynamics of FPARg in 2009 than in the other two years (Figs. 2b-2d).

    Seasonal patterns of FPAR observations (FPARg) and satellite-based FPAR estimations from 2009 to 2011 (a); and comparison with the FPARg from: 2009 (b); 2010 (c); and 2011 (d). Slope values (Slope) in (b-d) are the linear relationships between FAPRg and satellite-based FPAR estimations, and the dashed lines are the reference lines of 1:1. All linear

    Figure 2.Seasonal patterns of FPAR observations (FPARg) and satellite-based FPAR estimations from 2009 to 2011 (a); and comparison with the FPARg from: 2009 (b); 2010 (c); and 2011 (d). Slope values (<italic>Slope</italic>) in (b-d) are the linear relationships between FAPRg and satellite-based FPAR estimations, and the dashed lines are the reference lines of 1:1. All linear

    regressions are extremely significant (P 【-逻*辑*与-】lt; 0.0001).

    MethodDaily average FPAR estimations (n=21)Mean FPAR(n=63)
    Mean of SDRMSERPE (%)
    200920102011200920102011Mean200920102011MeanMean (SD)
    FPAR_MOD0.19 (0.08)0.21 (0.11)0.20 (0.09)0.160.190.160.1743.143.041.942.70.20 (0.09) a
    FPAR_LAI0.26 (0.16)0.30 (0.21)0.30 (0.20)0.130.200.160.1723.419.115.119.20.29 (0.19) b
    FPAR_NDVI0.34 (0.05)0.36 (0.05)0.36 (0.06)0.070.060.030.05-4.23.8-1.3-0.50.36 (0.05) c
    FPAR_EVI0.35 (0.05)0.36 (0.06)0.36 (0.05)0.070.060.030.05-4.14.51.2-0.30.35 (0.05) c
    FPARg0.33 (0.08)0.37 (0.10)0.35 (0.09)000000000.35 (0.08) c

    Table 1.

    Satellite-based FPAR estimations and comparisons with tower-based FPAR observations during the growing seasons from 2009 to 2011.

    However, FPAR_MOD and FAPR_LAI showed significant underestimations (P【-逻*辑*与-】lt;0.05, RMSE=0.17) compared with FPARg (42.7% and 19.2% of RPE, respectively) (Table 1 and Fig. 2). In addition, the daily average of FPARg was 0.35, and its CV for seasonal variations was relatively small (22.3%), while the CVs of seasonal variations for FPAR_MOD and FAPR_LAI were above 40%. Specifically, FPAR_MOD showed a consistent underestimation of FPARg throughout all growing seasons, and especially at the beginning and the end of the growing seasons (Fig. 2a). On the other hand, FAPR_LAI seriously underestimated FPARg at the beginning and the end of the growing season, despite of a significant overestimation of FPARg in the middle of the growing season (Fig. 2a). This resulted in maximum CV values (above 60%) throughout the growing season (Table 1).

    4 Discussion

    4.1 Comparison of FPAR estimations

    The seasonal dynamics of FPARg measurements from 2009 to 2011were captured by FPAR_MOD in the alpine meadow study area. During the past two decades, most of previous studies assessed the accuracies of MODIS FPAR/LAI and showed that the seasonal patterns of FPARg were in line with the FPAR_MOD (Hanan et al., 2002; Fensholt et al., 2004; Fu et al., 2012; Niu et al., 2016; Niu et al., 2017b; de Almeida et al., 2018), although the inter-annual variability of FPARg was always difficult to capture by the remote products (Verma et al., 2015) because the interaction between biotic and environmental conditions had seriously confounding effects on the smaller magnitudes of the inter-annual variations of FPAR (Wohlfahrt et al., 2008). However, FPAR_MOD significantly underestimated FPARg measurements (by over 40.0%) and FPAR_LAI (by approximately 30%) in this study. In contrast, a previous study compared FPAR_MOD and FPAR_LAI measurements in 2010 in 34 alpine grasslands of the northern Tibetan Plateau, and found that FPAR_MOD overestimated FPAR_LAI by 20%-24% at spatial scale for fenced and open grazed areas, respectively (Fu and Wu, 2017). The main reason for these different findings can be attributed to the different methods for comparing FPAR: seasonal in the case of this study and spatial in the case of the other study (Fu and Wu, 2017). Moreover, inter-annual variations of vegetation canopy densities and climate conditions might lead to different results. For example, this study showed that PAR accounts for about 43.4% of the total solar radiation, a value that is slightly lower than that of 44.2% measured from 2004 to 2007 in this alpine meadow (Zhang et al., 2009) However, both values were close to the constant (0.45) of the MOD17A2 algorithm (Heinsch et al., 2003; Niu et al., 2016). Many previous studies also showed that, compared with FPAR_MOD for different seasons and different spatial biomes, realistic ground FPARg could be undervalued (Olofsson and Eklundh, 2007; Zhang et al., 2008), overvalued (Fensholt et al., 2004; Turner et al., 2005; Fu et al., 2012) or be in a close agreement (Turner et al., 2006; Zhang et al., 2008) because of different vegetation canopy densities and climate conditions (Shi et al., 2006; Olofsson and Eklundh, 2007; Fu et al., 2012). Plateau ecosystems have undergone profound changes due to recent changes in climate conditions and human activities (Chen et al., 2014; Zhang et al., 2015; Du et al., 2018; Piao et al., 2019). This might result in the different estimates of FPAR_MOD over time at the same site.

    4.2 Improvements of satellite-based FPAR estimations

    Tower-based FPAR_LAI estimations derived from the Beer-Lambert law had a significant underestimation of FPARg by approximately 20% from 2009 to 2011 in the alpine meadow. This may be attributed to the constant k (0.5) in the Beer-Lambert law (Varlet-Grancher et al., 1980; Fu et al., 2012). Seasonal variations of k generally increased as the angle of the solar zenith angle increased (Wang et al., 2004), and as a result, the setting of k as a constant invariably resulted in FPAR_LAI estimation bias (Baldocchi et al., 1984; Wang et al., 2004; Saitoh et al., 2012). Actually, seasonal variation of k value derived from tower-based radiation and plant measurements in the study area and ranged from 0.19 to 2.95. Previous studies had suggested that remote indices (NDVI, EVI, and LSWI) had a robust ability to interpret seasonal FPARg (Fensholt et al., 2004), even FPAR calculated from NDVI and EVI gave better descriptions in grasslands for FPARg than FPAR_MOD (Zheng et al., 2018). At the same, recent remote-based GPP models use revised FAPR parameters for the MOD17A2 algorithm (Heinsch et al., 2003) describing the statistical functions of EVI and NDVI, and these also show better model performance for GPP estimations (Niu et al., 2017c; Zhang et al., 2019; Zhou and Xin, 2019). In this study, remote indices (NDVI, EVI, and LSWI) had a significant nonlinear relationship with FPARg (quadratic function) and the actual light extinction coefficient (kt) (exponential function) (P【-逻*辑*与-】lt;0.0001) (Fig. 3). By comparison, NDVI and EVI provided better FAPR simulations (higher R2) than LSWI (Fig. 3). In addition, FPAR_NDVI and FPAR_EVI provided better descriptions, with a negligible overestimation less than 5% of FAPRg (RMSE=0.05), in FPARg estimations than FPAR_MOD and FPAR_LAI did (Table 1).

    4.3 Satellite-based LAI estimations

    LAI_MOD substantially undervalued LAIg measurements rendering values of less than 30% of LAIg, although the values for seasonal dynamics matched well (Fig. 4). Compared with other studies, the LAIg value shown by LAI_MOD in this study was an obvious underestimation with a bias of -0.3 (Yin et al., 2017). However, this value was overestimated by approximately 2%-15% in semi-arid Senegal, indicating that the performance of LAI_MOD is site-specific. Thus, site-level cross-validation for comparison with local tower-based LAIg measurements should be undertaken in advance of using LAI_MOD to simulate water and carbon cycles in many ecological and hydrological models (Weiss et al., 2004; Cao et al., 2015; Zhu et al., 2017). In this study, taking satellite-based FPAR and kt estimations, the seasonal variations of LAI could be indirectly inversed from a simple remote vegetable index (NDVI or EVI) whose equation could be simply derived from Eqn. 9 as follows (Eq. 12):

    $LAIs=-\frac{\ln (1-{{f}_{2}}(\operatorname{NDVI}/EVI))}{{{f}_{e}}(\operatorname{NDVI}/EVI)}$

    where LAIs is satellite-based LAI estimations, f2 (NDVI/ EVI) and fe (NDVI/EVI) are the quadratic functions and the exponential function between FPAR/kt and NDVI/EVI in this study (Fig. 3). Both LAI_NDVI and LAI_EVI performed better in LAIg estimation (higher R2 and closer to 1:1 line) (Fig. 4). Many previous studies have investigated the relationship between remote vegetation indexes and LAI (or above ground biomass that was closely related to LAI) (Zhou et al., 2013; Kang et al., 2016; Liu et al., 2017). For example, linear NDVI/EVI based biomass/LAI models have performed well in alpine grasslands (Zhou et al., 2013; Liang et al., 2016). Therefore, this study provided a more efficient remote sensing method to develop rational simulations of the seasonal variations of photosynthetic parameters.

    Satellite-based estimations of the fractions of absorbed PAR by vegetation canopy (FPAR) and the extinction coefficient (kt) in the alpine meadow study area (n = 63)

    Figure 3.Satellite-based estimations of the fractions of absorbed PAR by vegetation canopy (FPAR) and the extinction coefficient (<italic>kt</italic>) in the alpine meadow study area (<italic>n</italic> = 63)

    Figure 4.

    5 Conclusions

    This study used tower-based meteorological and plant measurements to estimate the key photosynthetic parameters, FPARg, kt, and LAIg. Compared with satellite-based FPAR_MOD and LAI_MOD estimations, we introduced a pure satellite-based (NDVI and EVI) method derived from the Beer-Lambert law to estimate these parameters for the years 2009 to 2011 in a typical alpine meadow on the Tibetan plateau. Results showed that daily averages of FPARg were 0.33, 0.37 and 0.35, respectively, for the years 2009 to 2011. Tower-based FPAR_LAI estimations derived from the Beer-Lambert law provided significant underestimations of FPARg (approximately 20%) due to the constant k (0.5) being used throughout the entire growing season. This suggests that it is not appropriate to use FPAR_LAI to validate the FPAR_MOD. Indeed, considering that the seasonal variations of k range from 0.19 to 2.95, FPAR_NDVI and FPAR_EVI provided better descriptions in FPARg estimations, with a negligible overestimation less than 5% of FAPRg (RMSE=0.05), than did FPAR_MOD and FPAR_AI. The high temporal-spatial resolution of remote products made the satellite-based photosynthetic parameters for FPARg, kt, and LAIg estimation easy to upscale both temporally and spatially scale, especially in remote areas that were difficult to access for field observations. However, these satellite-based models should also be validated by site-specific tower-based radiation and plant measurements before they are upscaled, because the sun-sensor view geometry, soil color, and the fraction of diffuse light (on cloudy and clear sky days) might have detrimental effects on estimation accuracy.

    References

    [1] Baldocchi DD, Matt DR, Hutchison BA et al. Solar radiation within an oak—hickory forest: An evaluation of the extinction coefficients for several radiation components during fully-leafed and leafless periods. Agricultural and Forest Meteorology, 32, 307-322(1984).

    [2] Behera SK, SrivastavaP, Pathre UV et al. An indirect method of estimating leaf area index in Jatropha curcas L. using LAI-2000 Plant Canopy Analyzer. Agricultural and Forest Meteorology, 150, 307-311(2010).

    [3] CaoX, ZhouZ, ChenX et al. Improving leaf area index simulation of IBIS model and its effect on water carbon and energy—A case study in Changbai Mountain broadleaved forest of China. Ecological Modelling, 303, 97-104(2015).

    [4] Chen BX, Zhang XZ, TaoJ et al. The impact of climate change and anthropogenic activities on alpine grassland over the Qinghai-Tibet Plateau. Agricultural and Forest Meteorology, 189-190, 11-18(2014).

    [5] ChenH, ZhuQ, PengC et al. The impacts of climate change and human activities on biogeochemical cycles on the Qinghai-Tibetan Plateau. Global Change Biology, 19, 2940-2955(2013).

    [7] Chen JM, Blanken PD, Black TA et al. Radiation regime and canopy architecture in a boreal aspen forest. Agricultural and Forest Meteorology, 86, 107-125(1997).

    [8] de Almeida CT, Delgado RC, Galv?o LS et al. Improvements of the MODIS Gross Primary Productivity model based on a comprehensive uncertainty assessment over the Brazilian Amazonia. ISPRS Journal of Photogrammetry and Remote Sensing, 145, 268-283(2018).

    [9] DongJ, XiaoX, WagleP et al. Comparison of four EVI-based models for estimating gross primary production of maize and soybean croplands and tallgrass prairie under severe drought. Remote Sensing of Environment, 162, 154-168(2015).

    [10] DuM, LiY, ZhangF et al. Recent changes of climate and livestock productions on the Tibetan Plateau and in situ observations of NEE. Journal of Arid Land Studies, 28, 139-142(2018).

    [11] FensholtR, SandholtI, Rasmussen M S. Evaluation of MODIS LAI, fAPAR and the relation between fAPAR and NDVI in a semi-arid environment using in situ measurements. Remote Sensing of Environment, 91, 490-507(2004).

    [12] FuG, Shen ZX, Zhang XZ et al. Calibration of MODIS-based gross primary production over an alpine meadow on the Tibetan Plateau. Canadian Journal of Remote Sensing, 38, 157-168(2012).

    [13] FuG, Wu J S. Validation of MODIS collection 6 FPAR/LAI in the alpine grassland of the Northern Tibetan Plateau. Remote Sensing Letters, 8, 831-838(2017).

    [14] GaoY, YuG, LiS et al. A remote sensing model to estimate ecosystem respiration in Northern China and the Tibetan Plateau. Ecological Modelling, 304, 34-43(2015).

    [15] GaoY, YuG, YanH et al. A MODIS-based Photosynthetic Capacity Model to estimate gross primary production in Northern China and the Tibetan Plateau. Remote Sensing of Environment, 148, 108-118(2014).

    [16] Gitelson AA, Vi?aA, Verma SB et al. Relationship between gross primary production and chlorophyll content in crops: Implications for the synoptic monitoring of vegetation productivity. Journal of Geophysical Research: Atmospheres, 111, 1-13(2006).

    [17] Hanan NP, BurbaG, Verma SB et al. Inversion of net ecosystem CO2 flux measurements for estimation of canopy PAR absorption. Global Change Biology, 8, 563-574(2002).

    [18] Heinsch FA, ReevesM, VotavaP et al. GPP and NPP (MOD17A2/ A3) Products NASA MODIS Land Algorithm. MOD17 User's Guide:, 1-57(2003).

    [19] KangY, ?zdo?anM, ZipperS et al. How universal is the relationship between remotely sensed vegetation indices and crop leaf area index? A global assessment. Remote Sensing, 8, 597(2016).

    [20] LiJ, FangX. Uplift of the Tibetan Plateau and environmental changes. Chinese Science Bulletin, 44, 2117-2124(1999).

    [21] LiangT, YangS, FengQ et al. Multi-factor modeling of above- ground biomass in alpine grassland: A case study in the Three-River Headwaters Region, China. Remote Sensing of Environment, 186, 164-172(2016).

    [22] LiuS, ChengF, DongS et al. Spatiotemporal dynamics of grassland aboveground biomass on the Qinghai-Tibet Plateau based on validated MODIS NDVI. Scientific Reports, 7, 4182(2017).

    [23] NiJ. Carbon storage in grasslands of China. Journal of Arid Environments, 50, 205-218(2002).

    [24] NiuB, HeY, ZhangX et al. Tower-based validation and improvement of MODIS gross primary production in an alpine swamp meadow on the Tibetan Plateau. Remote Sensing, 8, 592(2016).

    [25] NiuB, HeY, ZhangX et al. CO2 exchange in an alpine swamp meadow on the Central Tibetan Plateau. Wetlands, 37, 1-19(2017).

    [26] NiuB, HeY, ZhangX et al. Satellite-based inversion and field validation of autotrophic and heterotrophic respiration in an alpine meadow on the Tibetan Plateau. Remote Sensing, 9, 615(2017).

    [27] NiuB, ZhangX, HeY et al. Satellite-based estimation of gross primary production in an alpine swamp meadow on the Tibetan Plateau: A multi-model comparison. Journal of Resources and Ecology, 8, 57-66(2017).

    [28] OlofssonP, EklundhL. Estimation of absorbed PAR across Scandinavia from satellite measurements. Part II: Modeling and evaluating the fractional absorption. Remote Sensing of Environment, 110, 240-251(2007).

    [29] PiaoS, ZhangX, WangT et al. Responses and feedback of the Tibetan Plateau’s alpine ecosystem to climate change. Chinese Science Bulletin, 64, 2842-2855(2019).

    [30] RossiniM, CogliatiS, MeroniM et al. Remote sensing-based estimation of gross primary production in a subalpine grassland. Biogeosciences, 9, 2565-2584(2012).

    [31] RuimyA, KergoatL, BondeauA et al. Comparing global models of terrestrial net primary productivity (NPP): Analysis of differences in light absorption and light-use efficiency. Global Change Biology, 5, 56-64(1999).

    [32] Running SW, Thornton PE, NemaniR et al. Global terrestrial gross and net primary productivity from the earth observing system, In: Sala O E, Jackson R B, Mooney H A, et al. (ed.), 44-57(2000).

    [33] SaitoM, KatoT, Tang Y. Temperature controls ecosystem CO2 exchange of an alpine meadow on the northeastern Tibetan Plateau. Global Change Biology, 15, 221-228(2009).

    [34] Saitoh TM, NagaiS, Noda HM et al. Examination of the extinction coefficient in the Beer-Lambert law for an accurate estimation of the forest canopy leaf area index. Forest Science and Technology, 8, 67-76(2012).

    [35] Shi PL, Sun XM, Xu LL et al. Net ecosystem CO2 exchange and controlling factors in a steppe - Kobresia meadow on the Tibetan Plateau. Science in China Series D-Earth Sciences, 49, 207-218(2006).

    [36] TangX, LiH, HuangN et al. A comprehensive assessment of MODIS-derived GPP for forest ecosystems using the site-level FLUXNET database. Environmental Earth Sciences, 74, 5907-5918(2015).

    [37] Turner DP, Ritts WD, Cohen WB et al. Site-level evaluation of satellite-based global terrestrial gross primary production and net primary production monitoring. Global Change Biology, 11, 666-684(2005).

    [38] Turner DP, Ritts WD, Cohen WB et al. Evaluation of MODIS NPP and GPP products across multiple biomes. Remote Sensing of Environment, 102, 282-292(2006).

    [39] Varlet-GrancherC, BonhommeR, JacobC et al. Caracterisation et evolution de la structure d'un couvert vegetal de canne a sucre, Annales agronomiques(1980).

    [40] VermaM, Friedl MA, Law BE et al. Improving the performance of remote sensing models for capturing intra- and inter-annual variations in daily GPP: An analysis using global FLUXNET tower data. Agricultural and Forest Meteorology, 214-, 215, 416-429(2015).

    [41] WagleP, Gowda PH, XiaoX et al. Parameterizing ecosystem light use efficiency and water use efficiency to estimate maize gross primary production and evapotranspiration using MODIS EVI. Agricultural and Forest Meteorology, 222, 87-97(2016).

    [42] WangQ, TenhunenJ, GranierA et al. Long-term variations in leaf area index and light extinction in a Fagus sylvatica stand as estimated from global radiation profiles. Theoretical and Applied Climatology, 79, 225-238(2004).

    [43] WeissM, BaretF, Smith GJ et al. Review of methods for in situ leaf area index (LAI) determination: Part II. Estimation of LAI, errors and sampling. Agricultural and Forest Meteorology, 121, 37-53(2004).

    [45] XiaoJ, ChevallierF, GomezC et al. Remote sensing of the terrestrial carbon cycle: A review of advances over 50 years. Remote Sensing of Environment, 233, 111383(2019). https://linkinghub.elsevier.com/retrieve/pii/S003442571930402X

    [46] XiaoX, HollingerD, AberJ et al. Satellite-based modeling of gross primary production in an evergreen needleleaf forest. Remote Sensing of Environment, 89, 519-534(2004).

    [47] XiaoX, ZhangQ, SaleskaS et al. Satellite-based modeling of gross primary production in a seasonally moist tropical evergreen forest. Remote Sensing of Environment, 94, 105-122(2005).

    [48] Xu LL, Zhang XZ, Shi PL et al. Modeling the maximum apparent quantum use efficiency of alpine meadow ecosystem on Tibetan Plateau. Ecological Modelling, 208, 129-134(2007).

    [50] YangX, TangJ, Mustard JF et al. Solar-induced chlorophyll fluorescence that correlates with canopy photosynthesis on diurnal and seasonal scales in a temperate deciduous forest. Geophysical Research Letters, 42, 2977-2987(2015).

    [51] YinG, LiA, JinH et al. Derivation of temporally continuous LAI reference maps through combining the LAINet observation system with CACAO. Agricultural and Forest Meteorology, 233, 209-221(2017).

    [52] ZhangB, ShiP, HeY et al. The climate feature of Damxung alpine meadow carbon flux research station on the Tibetan Plateau. Journal of Mountain Science, 27, 88-95(2009).

    [53] ZhangL, ZhouD, FanJ et al. Contrasting the performance of eight satellite-based GPP models in water-limited and temperature-limited grassland ecosystems. Remote Sensing, 11, 1333(2019).

    [54] ZhangX, YangY, PiaoS et al. Ecological change on the Tibetan Plateau. Chinese Science Bulletin, 60, 3048-3056(2015).

    [55] ZhangY, YuQ, Jiang J IE et al. Calibration of Terra/MODIS gross primary production over an irrigated cropland on the North China Plain and an alpine meadow on the Tibetan Plateau. Global Change Biology, 14, 757-767(2008).

    [56] ZhaoL, LiY, XuS et al. Diurnal, seasonal and annual variation in net ecosystem CO2 exchange of an alpine shrubland on Qinghai-Tibetan Plateau. Global Change Biology, 12, 1940-1953(2006).

    [57] ZhengD, ZhangQ, WuS. Mountain geoecology and sustainable development of the Tibetan Plateau. Dordrecht:. Springer.(2000).

    [58] ZhengY, ZhangL, XiaoJ et al. Sources of uncertainty in gross primary productivity simulated by light use efficiency models: Model structure, parameters, input data, and spatial resolution. Agricultural and Forest Meteorology, 263, 242-257(2018).

    [59] ZhouX, XinQ. Improving satellite-based modelling of gross primary production in deciduous broadleaf forests by accounting for seasonality in light use efficiency. International Journal of Remote Sensing, 40, 931-955(2019).

    [60] ZhouY, FuG, ShenZ et al. Estimation model of aboveground biomass in the Northern Tibet Plateau based on remote sensing date. Acta Prataculturae Sinica, 22, 120-129(2013).

    [61] ZhuZ, PiaoS, LianX et al. Attribution of seasonal leaf area index trends in the northern latitudes with “optimally” integrated ecosystem models. Global Change Biology, 23, 4798-4813(2017).

    Ben NIU, Yongtao HE, Xianzhou ZHANG, Peili SHI, Mingyuan DU. Satellite-based Estimates of Canopy Photosynthetic Parameters for an Alpine Meadow in Northern[J]. Journal of Resources and Ecology, 2020, 11(3): 253
    Download Citation