
Yixin Zhang, Tong Zhou, Zhewen Ding, Yanqing Lu, Xuping Zhang, Feng Wang, Ningmu Zou. Classification of interference-fading tolerant Φ-OTDR signal using optimal peak-seeking and machine learning [Invited][J]. Chinese Optics Letters, 2021, 19(3): 030601
- Chinese Optics Letters
- Vol. 19, Issue 3, 030601 (2021)
Abstract
1. Introduction
Phase-sensitive optical time-domain reflectometry (Φ-OTDR), as a rising star of a fully distributed optical fiber sensor (DOFS), has recently attracted significant attention for its merits like fast response, high sensitivity, and multi-point detection capacity[
However, phase-demodulated Φ-OTDR based on heterodyne coherent detection unavoidably suffers from interference fading, which is commonly attributed to the random nature of RBS[
In this paper, we propose an effective and simple method to suppress interference fading for Φ-OTDR sensing systems based on heterodyne detection. Since the phase-demodulated result is positively correlated with RBS intensity, we dynamically track the optimal location of RBS intensity in each section of the sensing fiber for reliable demodulated phase. The performance of our method is first verified in laboratory conditions and then tested in the field. The obtained results show that our method can suppress the occurrence probability of fading areas to a large extent and is expected to extend the engineering application realm of the existing phase-OTDR system.
Sign up for Chinese Optics Letters TOC. Get the latest issue of Chinese Optics Letters delivered right to you!Sign up now
2. Methods
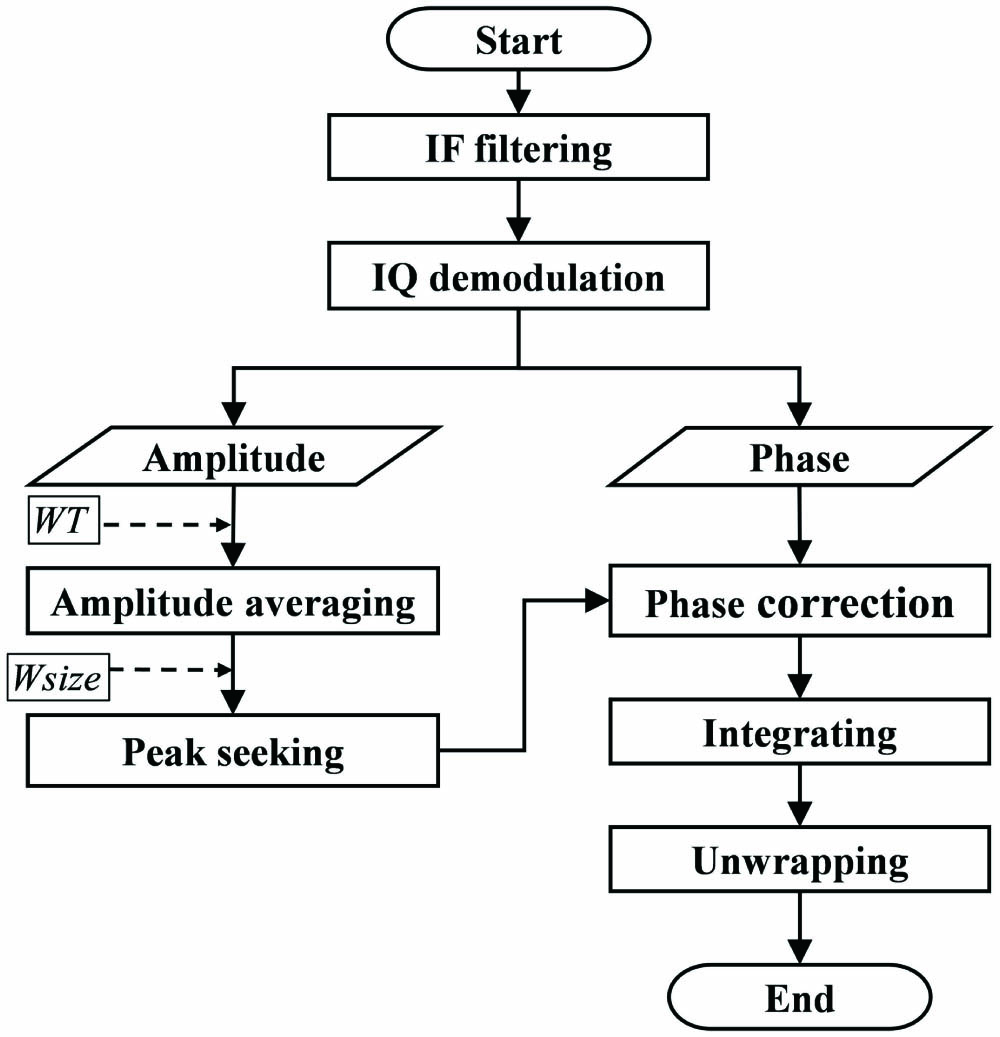
The flow chart of the proposed method is shown in Fig. 1. First, we perform band pass filtering on the beat signal to obtain the intermediate frequency (IF) component and then perform in-phase quadrature (IQ) demodulation[
![]()
Figure 1.Flow chart of fading suppression method.
![]()
Figure 2.(a) Probability of signal falling into the dead zone under different window size (100 ns). (b) Probability of signal falling into the dead zone under different pulse width.
Then, the position of amplitude peak in each interval is found, and the phase difference between nearby peaks is calculated. TD differencing is further performed on the phase difference result between current and previous measurements. Then, the vibration applied on the fiber could be reconstructed through integration and unwrapping[
Performance of the proposed method is verified by commercial Ф-OTDR equipment (Ada-5032E, Nanjing Fiber Technology Co., Ltd.), as shown in Fig. 3(a). Its internal structure and experiment setup are shown in Fig. 3(b).
![]()
Figure 3.(a) Ada-5032E. (b) Schematic diagram of the experiment. (NLL, narrow-linewidth laser; AOM, acoustic-optical modulator; FUT, fiber under test; EDFA, erbium-doped fiber amplifier; Cir, circulator; BPD, balanced photodetector; DAQ, data acquisition card; PZT, piezo transducer.)
A 3.7 kHz line-width laser (narrow-linewidth laser, NLL) operating at 1550.12 nm was selected as the light source. The output of the NLL was split into two parts at 80% and 20% as the probe light and the local reference light, respectively, by an optical coupler. The probe part was modulated into probe pulse with 150 MHz frequency shift induced by an acoustic-optic modulator (AOM). The probe pulse with pulse width of 100 ns and repetition rate of 1 kHz was amplified in an erbium-doped fiber amplifier (EDFA) and then launched into the fiber under test (FUT) through a circulator.
To simulate the external vibration, a piezo transducer (PZT) wrapped with 30-m-long single-mode fiber was located around 475 m along the sensing fiber, which is driven by a sinusoidal voltage signal with the frequency of 25 Hz. Then, a 1095 m fiber was placed at the far end of the FUT. The RBS light returning from the FUT mixed with the local reference light and finally was detected by a balanced photo detector (BPD) with 200 MHz bandwidth. An 8 bit data acquisition card (DAQ) continuously sampled the output data with a 1 GHz sampling rate. The phase demodulation was completed on a personal computer. We continuously recorded data for 300 s to guarantee that the RBS signal from all regions has enough time to experience various possible states. We take the 15 s phase result to show and perform short-time Fourier transform (STFT) to it. It can be clearly seen from Fig. 4 that the phase results obtained by the traditional method have eight errors in 4–9 s and 11–14 s, while the phase results obtained by the proposed method have no errors in 15 s.
![]()
Figure 4.STFT spectrum of phase results in 15 s. (a) Traditional method. (b) Proposed method.
3. Results
The phase results obtained by the proposed method within 5 min were statistically analyzed and compared with the traditional method. As shown in Fig. 5, the accuracy of the proposed method is always superior to the traditional method. To further verify the feasibility of our proposed method, we made an in-field test of buried power cable anti-breakage monitoring using a Ф-OTDR running both the traditional and proposed algorithms. We hit the ground 15 m away from the cable 10 times with periods around 3 s. Figure 6 shows the STFT spectrum of the events. Obviously, we can clearly distinguish 10 ramming with the proposed method, while the first four events were submerged in the noise if the traditional method is applied. Our fading suppression did lower the location accuracy as a tradeoff of the wider range of detectable frequency. In our experiment, the original instrument setup can tell the invasive events within , and the processed data can tell events located within . We are able to tell if the signal is a false alarm and further differentiate the type of invasive events through machine learning algorithms in real applications. This ability is much more important than the location accuracy. Furthermore, we are still able to detect the event locations by backtracking signals from neighboring regions and doing further analysis based on their phase and strength data separately.
![]()
Figure 5.Accuracy of two methods within 5 min.
![]()
Figure 6.STFT spectrum of 10 ramming ground tests. (a) Traditional method. (b) Proposed method.
![]()
Figure 7.(a) Excavator digging event. (b) Time domain wave pattern of an invasive event. (c) Frequency-domain image after STFT. (d) Binary image after threshold filtering.
Based on different applications, trigging events would have varied features and characteristics. In this research, we are focusing on events that could damage the infrastructure constructions, such as the invasive events of electric power transmission lines and tunnel construction accidents. In these physically invasive events, we need to recognize and differentiate disturbing cases, which may contain digging, knocking, hammering, and so on. It is computationally expensive to deal with original events data without data processing and filtering. Therefore, it is necessary to extract and digitalize event characteristics and reduce background noise so that both the training and testing models can be applied to events effectively (Table 1). We used multiple feature extraction algorithms based on the TD and frequency-domain (FD) signals from the invasive events. For the TD feature extraction, we first calculated the signal energy () as
Because is sensitive to high levels, if a sampling point has serious distortion, it will have a great impact on the parameters. Our proposed method has a good effect on signal distortion so that events with outlier SE can be removed. We also take the mean amplitude and standard deviation of all events into consideration. Moreover, the disturbance duration of the signal can reflect whether the disturbance event is transient or long-term. So, we divide duration into three levels, which will also be used to distinguish events:
To better extract the FD features, we first process the data with STFT. We observed an example of an excavator digging event, as shown in Fig. 7.
Based on the characters of events we collected, we categorized all events into five different types; each of them was labeled as 1–5 (Table 2). Then, we extracted all TD features of these events, such as SE, signal variance, and . After STFT transfer, we set a pixel value threshold and changed the original pattern into a binary image. Then, we extracted nine features from both TD and FD patterns. We applied the support vector machine (SVM)[
Moreover, we also tried the feedforward neural network for the same training and testing dataset. As shown in Fig. 8(b), there are 10 perceptrons in the hidden layer and five perceptrons in the output layer. We use tansig as the hidden layer transfer function, purelin as the output layer transfer function, and traingdx as the network training function. As a result, both the SVM and neural network models achieve high testing accuracy in most of cases (Table 3). For all cases with labels 1, 2, 3, and 5, both models can achieve 100% accuracy. For cases with the label 4, the accuracy is lower since the pile driver hitting events could be mislabeled as falling rock events (label 3).
![]()
Figure 8.(a) Parameter optimization results of SVM model. (b) Schematic structure of feedforward neural network. (c) Mean squared error.
4. Conclusions
In this report, a simple and effective method was introduced for interference-fading suppression in the -OTDR sensing system. The performance of our method has been demonstrated under both laboratory and field conditions. Experimental results have shown that our method can greatly suppress fading and obtain higher quality demodulated signals, which is expected to be a powerful method to enhance the performance of the -OTDR system in engineering applications. Based on the data after interference suppression, we applied different machine learning models to recognize the invasive events category. The promising results show potential applications of -OTDR equipment and future implementation with machine learning algorithms.
| Feature | Symbol | Description |
|---|---|---|
| Area | S | Total number of pixels |
| Perimeter | P | Number of pixels on edge |
| Compactness | Con | (Square of P)/S |
| Number of clusters | Nc | Number of connected pixel clusters |
Table 1. Definition of Pattern Features
| Event Category | Number of Samples | Label |
|---|---|---|
| Excavator digging | 93 | 1 |
| Engineering truck passing | 148 | 2 |
| Falling rock | 53 | 3 |
| Pile driver hitting | 37 | 4 |
| Directional drilling | 52 | 5 |
Table 2. Category and Counts of Samples and Labels
| Event | Number of Samples | Accuracy (%) | |
|---|---|---|---|
| SVM | FNN | ||
| Excavator digging | 24 | 100 | 100 |
| Truck passing | 41 | 100 | 100 |
| Rock falling | 13 | 100 | 100 |
| Stick ramming | 9 | 67 | 78 |
| Driller punching | 13 | 100 | 100 |
Table 3. Testing Dataset and Results of Both Models
References
[1] X. Bao, L. Chen. Recent progress in distributed fiber optic sensors. Sensors, 12, 8601(2012).
[5] J. P. F. Wooler, R. I. Crickmore. Fibre optic sensors for seismic intruder detection. Proc. SPIE, 5855, 27(2005).
[6] Y. Lu, T. Zhu, L. Chen, X. Bao. Distributed vibration sensor based on coherent detection of phase-OTDR. J. Lightwave Technol., 28, 3243(2010).
[7] P. Healey. Fading in heterodyne OTDR. Electron. Lett., 20, 30(1984).

Set citation alerts for the article
Please enter your email address
© Copyright 2018-2021 | Chinese Laser Press. All Rights Reserved 沪ICP备15018463号-20