
Peng Fei, Jun Nie, Juhyun Lee, Yichen Ding, Shuoran Li, Hao Zhang, Masaya Hagiwara, Tingting Yu, Tatiana Segura, Chih-Ming Ho, Dan Zhu, Tzung K. Hsiai. Subvoxel light-sheet microscopy for high-resolution high-throughput volumetric imaging of large biomedical specimens[J]. Advanced Photonics, 2019, 1(1): 016002
- Advanced Photonics
- Vol. 1, Issue 1, 016002 (2019)
Abstract
Keywords
1 Introduction
In optical microscopy, high-resolution (HR) volumetric imaging of thick biological specimens is highly desirable for many biomedical applications, such as development biology, tissue pathology, digital histology, and neuroscience. To obtain information on cellular events from the larger organism, e.g., a live embryo, intact tissue, or an organ, spatiotemporal patterns from the micro- to mesoscale must be in toto determined and analyzed.1
Here, we present an imaging method capable of providing three-dimensional (3-D) super-resolution and increased SBP for conventional LSM, without the involvement of mechanical stitching or complicated illumination modulation. This method, termed “subvoxel light-sheet microscopy (SLSM),” shares its roots with pixel super-resolution (PSR) techniques36,37,41
In this study, this SLSM capability is broadly verified by imaging various samples, such as 3-D cultured cells, a live zebrafish embryo, and intact mouse organs. In addition, we demonstrate that SLSM can be combined with multiview data fusion46 to achieve complete imaging of scattering samples, realizing an isotropic resolution of (compared with the original and ) throughout a volume of . In the following, we elucidate the SLSM experimental setup, discuss implementation of the subvoxel-resolving (SVR) computation, and demonstrate applications to whole-organism imaging.
Sign up for Advanced Photonics TOC. Get the latest issue of Advanced Photonics delivered right to you!Sign up now
2 Results
2.1 Off-Detection-Axis Scanning Setup
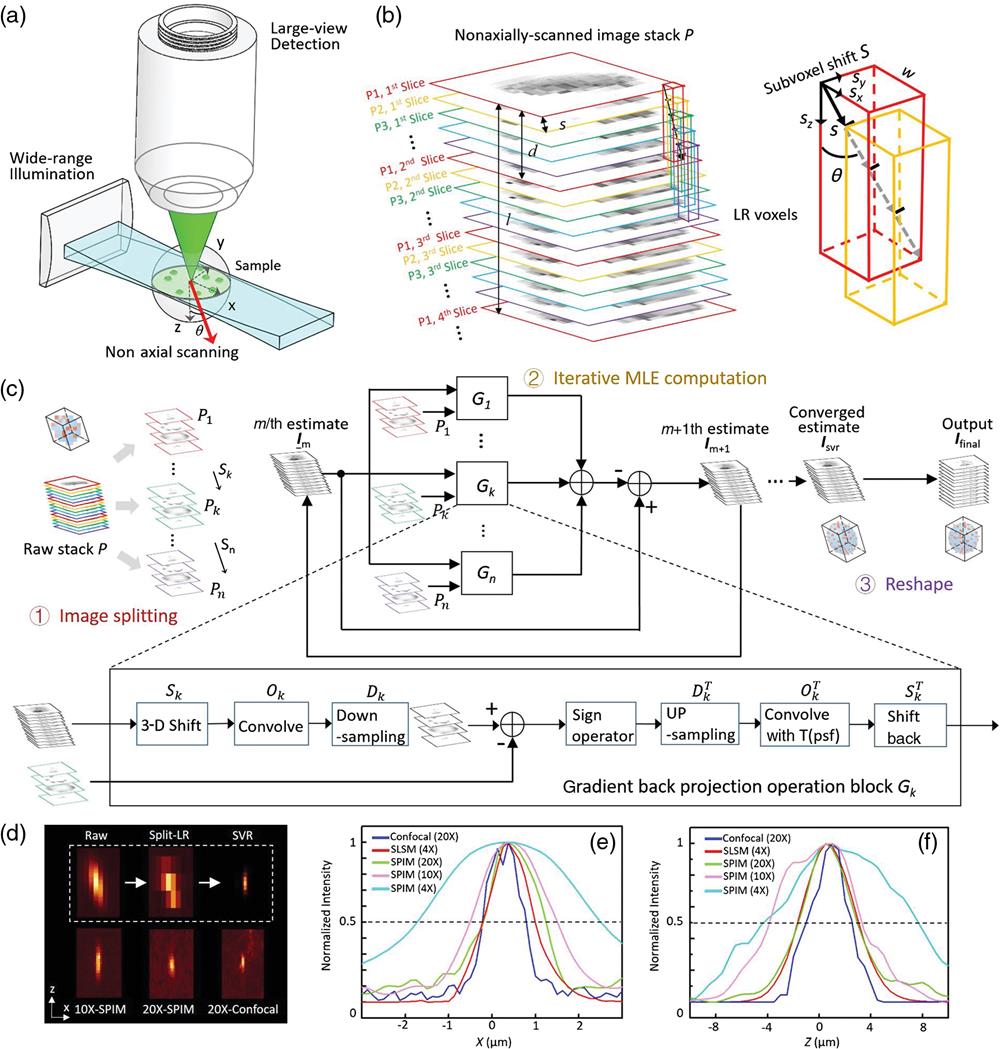
In this study, SLSM imaging was implemented based on a home-built selective plane illumination microscope (SPIM), which is a well-known LSM modality (see Methods and Fig. S1 in the Supplementary Materials for the full optical layout). This approach functions under a low-magnification setup with a wide-FOV covering the entire specimen. Unlike a regular SPIM with -scan parts, the SLSM additionally contains a customized tilting plate that can adjust the scanning axis, allowing sample scanning in a direction with a certain deviation angle relative to the axis (detection axis) [Fig. 1(a)]. As the sample is continuously moved across the laser sheet in this nondetection-axis direction, a camera records images of the sequentially illuminated planes at a high acquisition speed [Fig. 1(b)]. By matching the frame rate and scanning velocity , a fine step size , typically hundreds of nanometres (), is generated between adjacent frames [Fig. 1(b)]. Thus, every nonaxial incremental step provides unit subvoxel shift components , , and simultaneously in both the lateral and axial directions, through a one-directional scan [Fig. 1(b)]. In addition, this continuous scanning mode matched by fast camera acquisition provides SLSM with a high imaging throughput of up to hundreds of megavoxel per second. Depending on the sample size and fluorescence intensity, SLSM acquisition usually requires only a few seconds to a few minutes, finally generating a raw image stack containing thousands of spatially modulated frames.
![]()
Figure 1.Principles of SLSM. (a) SLSM geometry with wide laser-sheet illumination and large-FOV detection. The sample is scanned in one direction (red arrow) with the deviation angle
2.2 Principles of Subvoxel-Resolving Procedure
An SVR algorithm was designed to specifically segment the acquired shift-encoded, wide-view, LR image stack (denoted by ) into multiple substacks, model them as probability distributions with subtle spatial correlations, and reconstruct a final output image that encompasses significantly improved resolution over the entire large-volume sample [Fig. 1(c)]. In this approach, the raw image stack is first divided into a number of LR 3-D images (). In each LR , the voxel width is simply given by the ratio of the camera pitch size and magnification factor. The voxel depth , denoting the axial spacing implemented when extracting the slices from the raw stack, is set to approximately one-third of the laser-sheet longitudinal extent to satisfy the Nyquist sampling principle. The segmentation is, therefore, performed by reslicing the raw image every frames as shown in Figs. 1(b) and 1(c) (step 1). The number of total LR images , which implies the amount of subvoxel information extractable from the raw image, is determined by dividing one LR by ; this indicates that these images are correlated with each other in terms of the SVR displacements [Figs. 1(b) and 1(c)]. Each segmented LR can be considered as a blurred and undersampled “regular SPIM” image presenting standard resolutions determined by the system optics. Meanwhile, all the can be spatially registered to the HR image to be solved (also the reference image ), according to a nonaxial, SVR shift [Fig. 1(c): red-, green-, and purple-bordered images]. The SVR procedure then reconstructs the HR based on computation of these LR images modeled with their known subvoxel shifts, the system optical blurring, and the camera discretization.
The design of the SVR procedure follows a straightforward principle similar to PSR techniques functioning in the 2-D spatial domain.36,42 It seeks the super-resolved estimate that is most consistent with multiple measurements after a series of degradation operators that reasonably model the digital imaging process being successively applied.36,43 Here, can be specifically solved by minimizing the following cost function:
2.3 Imaging Characterization
Simulation results of the proposed SVR procedure are provided in Fig. S6 in the Supplementary Materials, whereas Figs. 1(d)–1(f) experimentally characterize the SLSM performance through imaging of fluorescent microbeads ( diameter) under a 4×/0.13 detection objective (DO) plus 0.022-NA plane illumination (PI) configuration. The microbeads were scanned along a of 10 deg (to the and planes) with of 144 nm, yielding an incremental lateral shift and axial shift of 25 and 140 nm, respectively. Then, 65 groups () of LR, 3-D images (voxel size: ) were extracted from the raw sequence to compute an SVR image with a fourfold enhancement in each dimension. The LR and SVR results were compared with midmagnification SPIM (10×/0.3-DO/0.04-NA PI), high-magnification SPIM (20×/0.45-DO/0.06-NA PI), and confocal microscope (20×/0.7 objective) images as shown in Fig. 1(d). The line intensity profiles of the resolved beads are shown in Figs. 1(e) and 1(f), to compare the lateral and axial resolutions of these methods. The achievable lateral and axial full widths at half maximum (FWHMs) of the 4×-SLSM were improved from and to and , respectively, being similar to the results for the 20×-SPIM and 20×-confocal microscope.
We validated the SLSM by obtaining HR reconstructions of 3-D-cultured normal human bronchial epithelial (NHBE) cell spheroids [labeled with 2-(4-amidinophenyl)-6-indolecarbamidine dihydrochloride (DAPI) nucleic acid staining, see Sec. 4] as shown in Fig. 2(a). A sequence of images from consecutively illuminated planes was rapidly recorded for 1 min under a 100-frames/s acquisition rate, targeting a specific volume-of-interest containing dense cell spheroids [Fig. 2(a)]. Note that each LR image subdivided from the raw stack simply adopts the limited resolution from the system optics; hence, only the rough shape and distribution of the selected spheroid were identified, whereas the single cells remained unresolvable [Fig. 2(b1)]. The SVR procedure then began with an initial guess, which was simply a interpolation of the first reference image [Fig. 2(b2)], and iteratively converged to the final HR image, where the chromatins inside the cell nucleus became distinguishable [Fig. 2(b3)]. Indeed, the linecuts through the cell spheroids [Fig. 2(d)] by each method revealed substantially improved resolution from SVR, which surpassed a 20×-SPIM result with an observable spherical aberration as shown in Fig. 2(c) and Fig. S3 in the Supplementary Materials.
![]()
Figure 2.SLSM demonstration of 3-D cultured NHBE cells. (a) NHBE cell spheroids 3-D cultured in a piece of Matrigel substrate. The cells were fluorescently labeled through DAPI nuclear staining for SLSM reconstruction. (b1) LR raw image of selected cell spheroid (first of 64 groups), captured under illumination and detection NAs of 0.022 and 0.13, respectively, with
In addition to the selective image planes, we compared the volume rendering of a reconstructed cell spheroid given by conventional 4×-SPIM and 4×-SLSM, with the latter explicitly showing much improved 3-D single-cell localization [Fig. 2(e)]. SLSM provides a wide-FOV of from its low-magnification DO (4×/0.13) and low NA PI (0.022), whereas its achieved resolutions are similar to those of 20×-SPIM (20×/0.45-DO/0.07-NA PI). Thus, the SLSM can be regarded as a light-sheet microscope combining the FOV advantage of 4×-SPIM with the resolution advantage of 20×-SPIM. From another perspective, its stitching-free, continuous scanning mode exhibits a much higher acquisition throughput as well as lower photobleaching than the stitching results of the 10×-SPIM, 20×-SPIM, and confocal microscope (Supplementary Notes).
We calculated the imaging resolution, speed, and photobleaching of 4×-SPIM, 10×-SPIM tile imaging, 20×-SPIM tile imaging, 20×-confocal microscopy, and 4×-SLSM. As shown in Fig. 2(f), the SLSM exhibited the highest effective throughput at megavoxel SBP per second, which is times higher than those of the other modalities. In addition to the increased SBP (FOV divided by resolution), the SVR computation, to some weak fluorescing extent, improves the signal-to-noise ratio after multiple image fusion (Fig. S7 in the Supplementary Materials). Furthermore, circumventing the use of high-NA, high-maintenance optics renders SLSM considerably less vulnerable to chromatic aberration occurring in multicolor illumination47 (Supplementary Notes and Fig. S2 in the Supplementary Materials), and resistant to the spherical aberration48,49 that causes severe image deterioration for deep tissue (Fig. S3 in the Supplementary Materials). In the applications described below, this underlying robustness allows the SLSM prototype to image thick specimens at high spatial–temporal performance while retaining a relatively simple setup.
2.4 Multicolor Three-Dimensional Whole-Organism Imaging at High Throughput
SLSM does not require special engineering of the fluorescence emission to generate image modulation, rendering it compatible with various labeling techniques. In Fig. 3, we demonstrate SLSM imaging of two types of specimen: an optically cleared intact mouse heart (neonate, D2) exhibiting endogenous autofluorescence in cardiomyocytes [Fig. 3(a)] and a two-color transgenic zebrafish embryo [3-day postfertilization (dpf)] tagged with green and red fluorescence proteins at the motor neurons (Islet1-GFP) and somite fast muscles (mlcr-DsRed), respectively [Fig. 3(b)]. Furthermore, a time-course study on an anesthetized live fish embryo from 48- to 72-h postfertilization (hpf) was implemented in this work to investigate the neuron/muscle development in the hindbrain region as shown in Fig. S9 in the Supplementary Materials. The raw data acquisition was very fast, at a rate above 200 megavoxels per second.
![]()
Figure 3.Rapid high-throughput volumetric imaging of whole organisms via SLSM. (a) 91-gigavoxel SVR reconstruction of optically cleared intact mouse heart (inset: neonate day 1) with endogenous autofluorescence. The magnified views of the slices along the indicated coronal and axial planes (i) and (ii) reveal that the SVR procedure substantively improves visualization of the cardiomyocytes compared with the raw images. The image acquisition and SVR reconstruction time for the entire heart were
Meanwhile, to match the high-speed acquisition, we developed a GPU-based parallel computation flow to greatly accelerate the SVR procedure simultaneously, super-resolving the large-scale data at a high-processing throughput above 100 megavoxels per second. Hence, SLSM can rapidly image (acquisition + computation) these millimetre-size organisms on a scale of dozens of gigavoxel, providing super-resolved cellular structure–function information, such as myocardium architectures and interactions of developing motor neurons with somite muscles, within a few minutes to an hour. In Figs. S10 and S11 in the Supplementary Materials, broader demonstrations of SLSM applications are provided, for whole-organism imaging of a Tg (cmlc2:GFP) adult zebrafish heart (60 dpf) and an ; murine heart (three colors, P1), which are spatially or temporally more challenging to regular light microscopes.
2.5 Multiview SLSM for Isotropic Super-Resolution Imaging
Despite the use of chemical clearing, light scattering from deep tissue continues to pose a challenge for optical microscopy. Both laser excitation and fluorescence emission experience deflection and attenuation, which together deteriorate signals severely. In addition, even light-sheet setup remains anisotropic for the imaging of mesoscale samples, showing suboptimal axial resolution for several applications, such as cell phenotyping and neuronal tracing.18 The multiview fusion method46,47 was previously developed to address these problems. It functions by registering, weighting, and fusing a number of image stacks recorded under different views and finally recovers a stack that shows complete signals with improved axial resolution.46
Here, we demonstrate that the SVR procedure can be combined with a multiview approach to in toto image thick and scattering samples at near isotropically improved resolution. We developed a four-view SLSM prototype by imaging a human umbilical vein endothelial cell (HUVEC) and human dermal fibroblast (HDF) 3-D sprouting network (Sec. 4). The cells were cocultured in a fibrinogen-based hydrogel mixed with dextran-coated Cytodex 3 microbeads (), finally forming a complex and light-scattering cellular network containing fibrinogen, HUVEC beads, and HDF cells.
First, the sample was rotated by 90 deg for each set of acquired 2×-SLSM data (2×/0.06 detection, 0.015-NA sheet illumination, 580-nm step size, 7000 frames in 140 s), with four views of the raw stacks being obtained in total. Each set was subvoxel-resolved separately based on 32 groups of segmented LR inputs, generating four views of the anisotropic SVR image ( enhancement). Multiview registration followed by weighted fusion was included in the final step to produce an output image with isotropic SVR. This multiview SVR (mv-SVR) workflow is shown in Fig. 4(a).
![]()
Figure 4.mv-SLSM for 3-D isotropic imaging of large scattering HUVEC-HDF cell sprouting network. (a) The mv-SVR procedure involves the following steps: (1) image acquisition under multiple views, (2) SVR computation for each view, (3) image registration in 3-D space, and (4) weighted mv-SVR fusion with final deconvolution. (b) 3-D reconstruction of cells obtained using a single-view SPIM (2×/0.06-DO/0.015-NA sheet-illumination) and four-view SLSM using the same optics. The SPIM system SBP is 1.1 gigavoxel for the entire sample, whereas four-view SLSM creates a 190-gigavoxel SBP that renders a higher resolution and more complete sample structure across a large FOV of
In Fig. 4(b), we compare the reconstructed volume renderings of a 0-deg SPIM image (1.1 gigavoxels, voxel size: ) and four-view SLSM (190 gigavoxels, reconstructed voxel size: ). Because of the strong scattering of the fibrinogen-microbead substrate, the single-view SPIM visualizes an incomplete structure with poor resolution [Fig. 4(b), left]. In contrast, the four-view SLSM reconstructs the entire sample, showing details of HUVEC sprouts from two adjacent dextran beads [Fig. 4(b), right]. HR local views containing dense HDF fibers are shown in Figs. 4(c) and 4(d), also compared with single-view SPIM results. In addition to the isotropically improved resolution [resolvable distance: ; Fig. 4(d), inset] that enables clear identification of single sprouting HDF cells, the multiview SLSM (mv-SLSM) also restores the highly light-scattered area in the reference view [Fig. 4(d), left]. Note that multiview subvoxel computation relies on the image registration and weighted fusion in a Fourier space and, therefore, the processing speed of four-view-fused SVR is order lower than the computation for a single-view, reconstructing 18 megavoxels per second on average. Finally, by creating an isotropic, HR, panoramic visualization that encompasses 190 gigavoxels across a volume exceeding (total processing time: ), the mv-SVR procedure can accurately analyze vast numbers of cells, such as sprouting branches and tip filopodia, over a piece of mesoscale tissue. Hence, mv-SVR provides a solid foundation for the exploration of mature vessel formation and vessel anastomosis processes, both of which are crucial for studying tissue regeneration.
2.6 Fast Quantitative Mapping of Mouse-Brain Neuronal Networks
We reconstructed a P30 Thy1-GFP-M mouse brain using an eight-view SLSM [Fig. 5(a)]. HR volumetric renderings of the (i) hippocampus, (ii) thalamus, and (iii) cortex regions are shown in Figs. 5(b)–5(d), respectively. Compared with conventional SPIM with suboptimal quality, the eight-view SLSM imaging resolved fine neuronal substructures such as dendrites and axons at an isotropic resolution of (350-gigavoxel SBP). Benefitting from remarkably improved visualization, neuronal subsets such as clustered astrocyte neurons in the thalamus region could be segmented with clearly separated nerve fibers [Fig. 5(e), Imaris software]. Three long-projection neurons were also successfully identified and registered in the P30 reference mouse brain. The pathways of these projection neurons were subsequently annotated according to the standard mice brain atlas51 as shown in Figs. 5e(ii)–5e(iv). The HR, high-throughput features of SLSM enable fast and accurate tracing of both long-distance projections and pathways within the neuronal circuits in the brain of a fluorescent protein transgenic mouse.
![]()
Figure 5.Three-dimensional neuronal mapping of adult mouse brain via an eight-view SLSM. (a) Isotropic SVR volume rendering of optically cleared Thy1-GFP-M mouse brain block (350-gigavoxel scale; scale bar:
3 Discussion
SLSM is based on an unconventional off-axis scanning together with subvoxel reconstruction, so as to computationally surpass the resolution limit of a regular light-sheet microscope. This technique can be applied to most existing light-sheet microscopes by retrofitting with a readily available tilting stage, thereby expanding the optical throughput for fast HR mapping of large biomedical specimens. In principle, the SVR procedure estimates a 3-D image that best suits a certain conditional probability in the spatial domain. Provided the aperture function and subvoxel motion are accurately characterized, the maximum-likelihood link between the actual sample profile and recorded data allows the SVR to iteratively render an HR image using a limited-NA, undersampled configuration, which was originally incapable of providing such a small PSF (Fig. 1).
Unlike most super-resolution fluorescence microscopy methods, which image a single cell or a few cells beyond the diffraction limit through processing of multiple frames acquired by patterned illumination or stochastic activation of molecules under highly specialized optics, SLSM is free from either illumination modulation or particular fluorescence labeling, being designed to rapidly enhance the inadequate accuracy obtained by unraveling large organisms under an ordinary small-NA/large-view configuration. Its stitching-free, high-speed image acquisition followed by a parallelized GPU processing flow provides super-resolved 3-D visualization at a quasireal-time throughput. In this work, by imaging a variety of biological specimens from 3-D cells to developing embryos and intact organs, our SLSM robustly exhibited improved performance at low hardware and time cost, using efficient computation to circumvent the trade-off between larger imaging volume and more resolvable detail. The ability to rapidly accomplish cellular imaging of mesoscale organisms at hundreds-of-gigavoxel SBP renders SLSM a valuable tool for wide biomedical applications, such as phenotype screening, embryogenesis and brain connectome in histology, development, and neuroscience research, for which both large-scale statistics and HR details are highly desired.
In addition to a single-view mode, SLSM can also be expanded by combination with multiview fusion. Through a rational balance between higher throughput and increased views, mv-SLSM can image thick and scattering samples with isotropic super-resolution and at moderately high-throughput. More broadly speaking, this method is currently optimized for LSM, which has a relatively high-image contrast and fast acquisition rate. However, the nonaxial scan as well as the SVR computation may be equally suited to other 3-D microscopy methods, such as confocal microscopy and 3-D deconvolution microscopy. Furthermore, we believe this subvoxel imaging strategy could prove to be transformative as it provides a general iterative resolution recovery method that could potentially be employed to improve other 3-D imaging modalities, which are possibly limited by inadequate sampling and poor focusing capability.
4 Methods
4.1 Experimental Setup
A four-wavelength, fiber-coupled semiconductor laser (CNI Laser, RGB 637/532/488/405, China) was used as an excitation source. The laser was first transformed into a collimated Gaussian beam with diameter of ( value). Then, an adjustable mechanical slit (0- to 8-mm aperture) was used to truncate the beam in the horizontal direction and thereby tune the aperture of PI. The illuminating cylindrical lens (focal length ) finally formed a wide laser sheet that optically sectioned large specimens with an NA adjustable from 0 to 0.1. Then, a or (Nikon Plan Apo Fluor 2×/0.06 or 4×/0.13 objective) infinity-corrected, wide-field detection path was constructed orthogonally to the PI path to collect the fluorescent signals. A four-degree-of-freedom motorized stage ( translation and rotation around the axis, Thorlabs) integrated with a pair of customized tilting plates was constructed for sample mounting and scanning across the laser sheet in an off-detection-axis direction (Fig. S1 in the Supplementary Materials). For a given imaging configuration, the choice of was balanced between generating a small lateral shift component for a larger enhancement factor and scanning a short axial distance when completing an entire voxel shift. Usually, the diagonal of the LR voxel is chosen as the nonaxial scanning axis, with being 10 deg to 15 deg. A scientific complementary metal–oxide semiconductor camera (Hamamatsu Orca Flash 4.0 v2 or Andor Zyla 5.5, pitch size: ) continuously recorded the planar images from the consecutively illuminated planes at a high speed of up to 200 frames/s.
4.2 SPIM, SLSM, and Multiview SLSM Acquisition
For the conventional SPIM imaging, the sample was scanned along the axis with 2- to step size depending on the different illumination NAs. To avoid motion blur generated by these incremental moves of several microns, it was necessary to implement the -scan in a step-by-step manner by synchronizing the laser, motor, and camera using LabVIEW software (version 2014, National Instrument). This stepwise -scan limited the acquisition speed to a maximum rate of 13 frames/s in our system (Thorlabs stepper ZST225B). Further, 10×- and 20×-tile SPIM imaging was automatically implemented in a raster scanning method, and the acquired mosaic volumes were subsequently stitched together using the grid/collection stitching plugin (ImageJ Software). Each time, only a small region of the entire illuminated plane was imaged; thus, the tile imaging was subjected to a photobleaching rate higher than those for the SPIM and SLSM.
For SLSM imaging, the camera was synchronized with a continuous sample scan under LabVIEW control, recording images in a sequential mode. The step size could, thus, be determined by matching the scanning velocity (10 to ) and camera frame rate (20 to 200 frames/s). Depending on the sample dimension, tilt angle, and enhancement factor, this value varied from 140 to 600 nm. Compared with the voxel size of several microns in the segmented LR volumes, the motion blur caused by the continuous scan was negligible under such a small step size and did not affect the SVR computation accuracy. At the same time, the SLSM image acquisition could be fast under continuous mode, taking 30 to 300 s to obtain a sequence containing thousands to tens of thousands of frames. For multiview imaging, the stepper rotated the thick and scattering samples four to eight times, acquiring a number of raw SLSM image stacks under different views. The data stream was transferred from the camera to a redundant arrays of independent drives 0 volume of solid-state drives ( crucial M550 1TB) in real time. The raw images were finally saved in a 16-bit TIFF format on the gigavoxel to tens of gigavoxel scale.
4.3 Efficient GPU-Accelerated SVR Reconstruction
In practice, a steepest descent method was used in the SVR computation to iteratively approach a converged super-resolved solution at high efficiency. Here
Reconstructing data with volumes of tens to hundreds of gigavoxels for large specimens would require an impractically long time, i.e., multiple days. Therefore, we developed a GPU-based parallel workflow to accelerate the processing, achieving near 3-order acceleration (Table S1 in the Supplementary Materials). Depending on the degree of parallelization and the number of views provided, the processing throughput varied from tens to hundreds of megavoxels per second, depending on the power of the dual NVidia TESLA P100 graphical cards. For example, in a single-view configuration, the program explicitly finished an HR reconstruction of an intact heart in (90 gigavoxels) and a dual-color reconstruction of an entire zebrafish embryo in (34 gigavoxels). It should be noted that this speed could be further increased by employing additional GPUs.
For mv-SVR of thick and scattering HUVEC–HDF sprouting, 32 groups of LR images were extracted from the raw sequence of each view. The unit lateral and axial shifts were 100 and 558 nm, respectively. Considering the optical blurring and camera undersampling, the effective lateral and axial resolutions of each LR image were and , respectively, yielding -gigavoxel SBP (voxel size: ) over volume.
Applying the aforementioned SVR procedure, the super-resolved image obtained under each view could be reconstructed as intermediate results. In each reconstructed , an increased SBP of 34 gigavoxels was presented anisotropically ( voxel spacing). According to the reported multiview fusion method, we interpolated all with isotropic pitch size, rotated the second view, and registered it to the 0-deg reference view by iteratively matching their histograms. An initial fusion of the images was generated by taking the weighted average of the two registered views in a Fourier space:
A multiview deconvolution was applied in the last step to obtain the deblurred output, which exhibited a final SBP of gigavoxels with isotropically improved resolution. Implementation of the SVR and mv-SVR methods is also detailed in the Supplementary Notes. At present, as a proof-of-concept, the mv-SVR is based on histogram registration and weighted fusion, and has not been performance optimized. Note that more efficient bead-based registration50 and Bayesian deconvolution52 have recently been reported. We believe that SVR can be combined with these techniques to yield even better image quality and higher speed. Further, the capacity was verified using four-view data in this work; however, it is quite certain that the result can be further optimized through provision of additional views.46
4.4 Image Visualization and Analysis
The visualizations of SPIM, SLSM, and confocal data were performed using Amira (Visage Imaging). Planar images were presented in their original formats, unless otherwise mentioned, with no sharpening, interpolation, or registration applied. Maximum intensity projections and volume renderings were performed using the ProjectionView and Voltex functions in Amira with built-in colormaps. Long-projection neuronal tracing of the clarified mouse brain was performed using the Filament module in Imaris (Bitplane). See the supplementary figures for additional details and spatiotemporal visualizations of the developing zebrafish embryo, adult zebrafish fish heart, and neonate mouse heart.
4.5 Preparation of Large-Scale, 3-D Cultured Cells
NHBE cells (Lonza, Walkersville, Maryland) were prepared. The growth factor-reduced reconstituted basement membrane known as Matrigel (BD Biosciences, Bedford, Massachusetts) was used for the 3-D culture experiments. The cells were seeded into of Matrigel in a liquid state and gently mixed with a pipette. The cells were then placed in a 24-well plate and incubated for 25 min at 37°C to gelatinize. Next, 1 mL of bronchial epithelial growth medium (Lonza, Walkersville, Maryland) was added to the 24-well plate and the medium was exchanged every other day.
4.6 Fluorescent Staining
Direct and indirect immunofluorescent stainings were applied to the cells to visualize the branching structure. For fixation, 4% paraformaldehyde (Electron Microscopy Science, Hatfield, Pennsylvania) was applied to the Matrigel at room temperature for 20 min. After washing with phosphate-buffered saline (PBS), PBS-containing 0.5% Triton X-100 was applied for cell permeabilization for 10 min at 4°C. This was followed by three 10-min washes with PBS. Then, the gels were blocked with 10% goat serum and 1% goat antimouse immunoglobulin G (Sigma-Aldrich, St. Louis, Missouri) in immunofluorescence buffer (0.2% Triton X-100; 0.1% bovine serum albumin and 0.05% Tween-20 in PBS). As a primary antibody, rabbit E-cadherin monoclonal antibody (Life Technologies, Grand Island, New York) was incubated with Matrigel overnight at 4°C and the gel was rinsed three times with 10% goat serum for 20 min each. Then, Alexa Fluor 555 goat antirabbit IgG was incubated for 2 h at room temperature followed by three 20-min rinses with PBS. For nuclear staining, DAPI was incubated for 20 min at room temperature followed by three 20-min rinses.
HUVECs were mixed with dextran-coated Cytodex 3 microcarriers at a concentration of 400 HUVEC per bead in 1 mL of endothelial cell growth medium (EGM)-2. The beads with cells were shaken gently every 20 min for 4 h at 37°C and 5% , and then transferred to a tissue culture flask and left for 12 to 16 h in 5 mL of EGM-2 at 37°C and 5% . In the following day, the beads with cells were washed three times with 1 mL of EGM-2 and resuspended at a concentration of 500 beads/mL in 2-mg/mL fibrinogen, 1-U/mL factor XIII, 0.04-U/mL aprotinin, and 80,000-cell/mL HDF at a pH of 7.4. Then, of this fibrinogen/bead solution was added to 0.16 units of thrombin in one well of each of the glass-bottom 24-well plates. The fibrinogen/HUVEC bead/HDF cell solution was allowed to clot for 5 min at room temperature and then at 37°C and 5% for 20 min. EGM-2 was added to each well and equilibrated with the fibrin clot for 30 min at 37°C and 5% . The medium was removed from the well and replaced with 1 mL of fresh EGM-2 and was later changed every other day. The coculture assays were monitored for 7 days and then fixed and stained with Alexa Fluor 488 for imaging of the cytoskeletons.
4.7 Zebrafish Embryo Culture
Transgenic zebrafishes (Islet1:GFP-mlcr:DsRed and cmlc2:GFP) were raised in the zebrafish core facility of the University of California, Los Angeles (UCLA). All experiments were performed in compliance with the approval of the GLA Institutional Animal Care and UCLA Institutional Animal Care and Use Committee protocols. To maintain transparency of the zebrafish embryos, they were incubated with egg water containing 0.2-mM 1-phenyl-2-thio-urea (Sigma) to suppress pigmentation at 24 hpf. The live fish embryos were anesthetized with low-concentration tricaine (0.04 mg/mL, MS-222, Sigma) before being mounted in a fluorinated ethylene propylene tube for sustained imaging.
4.8 Optical Clearing of Thick Organs
The adult mouse brain (Thy1-GFP-M), neonate mouse heart (wild-type, αMHCCre; R26VT2/GK), and adult zebrafish heart (cmlc2-GFP) were originally turbid organs. As a result, it was necessary to perform tissue optical clearing before fluorescence imaging. An organic-solvent-based clearing method (uDISCO)53 was used to clarify the adult mouse brain and zebrafish heart, and a hydrogel-based clearing (CLARITY)2 method was used to clarify the neonate mouse hearts.
Peng Fei received his PhD from Peking University in 2012 and then joined University of California, Los Angeles (UCLA) as a postdoctoral fellow. From 2015, he joined Huazhong University of Science and Technology (HUST), Wuhan, China, as a professor in School of Optical and Electronic Information (OEI). He has published over 30 academic papers which have been cited over 2000 times. His group is currently interested in developing novel bioimaging techniques, especially advanced light-sheet fluorescent microscopy.
Jun Nie is currently a PhD student in the Department of Optical and Electronic Information, Huazhong University of Science and Technology. He is focusing on advanced light-sheet fluorescence microscopy for high-throughput volumetric imaging of various types of biomedical samples.
Juhyun Lee is an assistant professor at the University of Texas, Arlington. He received his PhD in the Department of Bioengineering, UCLA, in 2016. His research focuses on cardiovascular biomechanics based on light-sheet imaging with computational methods.
Tzung K. Hsiai is the Maud Cady Gutham endowed chair and professor of medicine and bioengineering at UCLA. He received his undergraduate education from Columbia University and his medical training from the University of Chicago. He completed his internship, residency, and NIH-funded cardiovascular fellowship at UCLA, School of Engineering and Medicine, where he developed microsensors to study mechano-transduction underlying vascular injury and repair. Elected to the American Society for Clinical Investigation, he is a member of National Institutes of Health Bioengineering, Biotechnology, and Surgical Science Study Section, a fellow of the American College of Cardiology and the American Heart Association, a college fellow of American Institute of Medical and Biological Engineering, and a recipient of the American Heart Association John J. Simpson Outstanding Research Achievement Award, the USC School of Engineering Junior Faculty Research Award, and the UCLA SEAS Distinguished Young Alumnus Award.
Biographies of the other authors are not available.
References
[7] J. W. Lichtman, J. A. Conchello. Fluorescence microscopy. Nat. Methods, 2, 910-919(2005).
[35] W. Luo et al. Synthetic aperture-based on-chip microscopy. Light: Sci. Appl., 4, e261(2015).
[48] M. Born, E. Wolf(2013).
[51] G. Paxinos, K. B. Franklin(2004).

Set citation alerts for the article
Please enter your email address
© Copyright 2018-2021 | Chinese Laser Press. All Rights Reserved 沪ICP备15018463号-20