• Photonics Research
  • Vol. 10, Issue 12, 2828 (2022)
Hui Guo1、2, Na Liu1、2, Zhi Li1、2, Rongguo Yang1、2, Hengxin Sun1、2, Kui Liu1、2、3、*, and Jiangrui Gao1、2、4、*
Author Affiliations
  • 1State Key Laboratory of Quantum Optics and Quantum Optics Devices, Institute of Opto-Electronics, Shanxi University, Taiyuan 030006, China
  • 2Collaborative Innovation Center of Extreme Optics, Shanxi University, Taiyuan 030006, China
  • 3e-mail:
  • 4e-mail:
  • show less
    DOI: 10.1364/PRJ.469340 Cite this Article Set citation alerts
    Hui Guo, Na Liu, Zhi Li, Rongguo Yang, Hengxin Sun, Kui Liu, Jiangrui Gao. Generation of continuous-variable high-dimensional entanglement with three degrees of freedom and multiplexing quantum dense coding[J]. Photonics Research, 2022, 10(12): 2828 Copy Citation Text show less
    Generation of the 3-DoFs quantum state. (a) Photon pairs produced via the nonlinear optical process can have simultaneously entanglement in 3 DoFs—polarization, spatial mode, and frequency. (b) A pair of 3-DoFs entangled photons is the output of a multimode OPO; they have symmetrical “energy levels” [E=ℏ(ω±nΩ)], antipodal topologies charge (OAM=LG0+l,LG0−l), and orthogonal polarization (H,V). Each pair of energy levels contains right modes, and the energy-level interval is an FSR of the OPO. (c) Diagrams of entangled pairs for measurement.
    Fig. 1. Generation of the 3-DoFs quantum state. (a) Photon pairs produced via the nonlinear optical process can have simultaneously entanglement in 3 DoFs—polarization, spatial mode, and frequency. (b) A pair of 3-DoFs entangled photons is the output of a multimode OPO; they have symmetrical “energy levels” [E=(ω±nΩ)], antipodal topologies charge (OAM=LG0+l,LG0l), and orthogonal polarization (H,V). Each pair of energy levels contains right modes, and the energy-level interval is an FSR of the OPO. (c) Diagrams of entangled pairs for measurement.
    Experimental setup for the generation and measurement of the 3-DoFs entanglement state. (a) We generate the 3-DoFs entanglement through a type-II parametric down-conversion process in a multimode OPO, which is pumped with the LG10 mode. This is obtained by utilizing a four-quadrant phase mask (FQ-PM), cavity (Filter), and an HG11−LG10 mode converter (MC) to shape the Gaussian laser at 540 nm. The high-dimensional entanglement states are interrogated by balanced homodyne detection (BHD) with spatial and frequency tailored local oscillators (LOs). Fiber amplitude modulator (FAM), two-quadrant phase mask (TQ-PM), high reflectivity (HR) mirror, dichroic beam splitter (DBD), polarization beam splitter (PBS), half-wavelength plate (HWP), spectrum analyzer (SA), Dove prism (DP). (b) Placement of the KTP crystals in the OPO. x, y, and z are the axes of the KTP crystal.
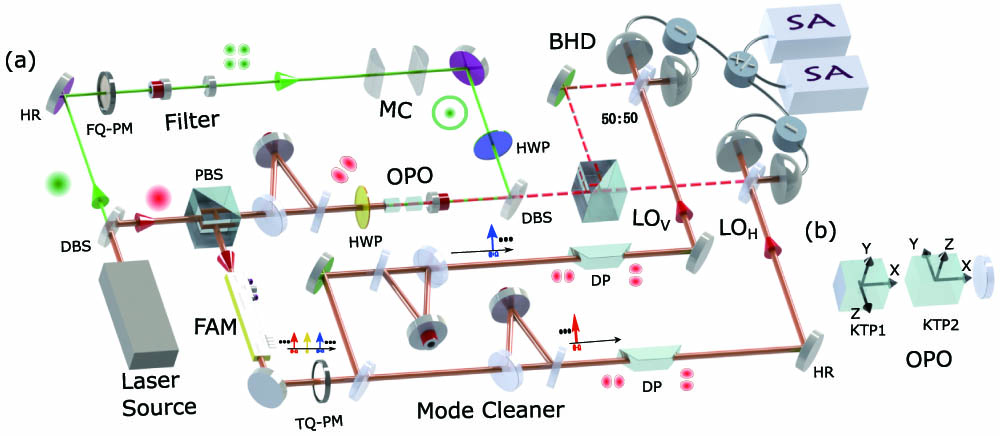
    Fig. 2. Experimental setup for the generation and measurement of the 3-DoFs entanglement state. (a) We generate the 3-DoFs entanglement through a type-II parametric down-conversion process in a multimode OPO, which is pumped with the LG10 mode. This is obtained by utilizing a four-quadrant phase mask (FQ-PM), cavity (Filter), and an HG11LG10 mode converter (MC) to shape the Gaussian laser at 540 nm. The high-dimensional entanglement states are interrogated by balanced homodyne detection (BHD) with spatial and frequency tailored local oscillators (LOs). Fiber amplitude modulator (FAM), two-quadrant phase mask (TQ-PM), high reflectivity (HR) mirror, dichroic beam splitter (DBD), polarization beam splitter (PBS), half-wavelength plate (HWP), spectrum analyzer (SA), Dove prism (DP). (b) Placement of the KTP crystals in the OPO. x, y, and z are the axes of the KTP crystal.
    Results for the quantum correlations of the fourth-order frequency sidebands. The 28 quantum correlations vary with local phase correspondingly. The smooth curve (red) is the fitting to the experimental data (blue). Below the shot noise limit (SNL) (Trace 1), indicate the squeezing of noise. The resolution and video bandwidths are 1 MHz and 1 kHz, respectively. (I) Central frequency. (II) First-order frequency sideband. (III) Second-order frequency sideband. (IV) Third-order frequency sideband.
    Fig. 3. Results for the quantum correlations of the fourth-order frequency sidebands. The 28 quantum correlations vary with local phase correspondingly. The smooth curve (red) is the fitting to the experimental data (blue). Below the shot noise limit (SNL) (Trace 1), indicate the squeezing of noise. The resolution and video bandwidths are 1 MHz and 1 kHz, respectively. (I) Central frequency. (II) First-order frequency sideband. (III) Second-order frequency sideband. (IV) Third-order frequency sideband.
    Experimental setup for the quantum dense coding. At the Alice station, a 3-DoFs auxiliary field is coded on amplitude, phase quadrature, and coupled with the previous shared entanglement state. Then, the amplitude or phase information is decoded successively with the aid of the other shared entanglement state at the Bob station. fiber amplitude modulator (FAM), QP vortex phase plate, half-wavelength plate (HWP), amplitude modulator (AM), phase modulator (PM), signal source (SS), local oscillator (LO), and spectrum analyzer (SA).
    Fig. 4. Experimental setup for the quantum dense coding. At the Alice station, a 3-DoFs auxiliary field is coded on amplitude, phase quadrature, and coupled with the previous shared entanglement state. Then, the amplitude or phase information is decoded successively with the aid of the other shared entanglement state at the Bob station. fiber amplitude modulator (FAM), QP vortex phase plate, half-wavelength plate (HWP), amplitude modulator (AM), phase modulator (PM), signal source (SS), local oscillator (LO), and spectrum analyzer (SA).
    Results for quantum dense coding with different schemes. (I) shows the conventional QDC scheme coded on the HG10 mode. (II) is the HG MQDC scheme coded on the superposition modes (HG10,HG01). (III) is the space-frequency MQDC shceme coded on the six-mode superposition modes (HG10ω−Ω, HG10ω, HG10ω+Ω, HG01ω−Ω, HG01ω, HG01ω+Ω). The black trace is the shot noise limit (SNL). The left columns (a) and (c) and right columns (b) and (d) in each dotted box are power spectra for amplitude quadrature and phase quadrature normalized to the SNL. The red lines from light to dark are measured with corresponding average photon number m, the darker the color, the larger the m. The blue traces are the noise power spectra without modulation. We can get the signal power and the noise power from the blue trace and peak of the red trace. (I) Conventional QDC. (II) HG mode MQDC. (III) HG mode and frequency side mode MQDC.
    Fig. 5. Results for quantum dense coding with different schemes. (I) shows the conventional QDC scheme coded on the HG10 mode. (II) is the HG MQDC scheme coded on the superposition modes (HG10,HG01). (III) is the space-frequency MQDC shceme coded on the six-mode superposition modes (HG10ωΩ, HG10ω, HG10ω+Ω, HG01ωΩ, HG01ω, HG01ω+Ω). The black trace is the shot noise limit (SNL). The left columns (a) and (c) and right columns (b) and (d) in each dotted box are power spectra for amplitude quadrature and phase quadrature normalized to the SNL. The red lines from light to dark are measured with corresponding average photon number m, the darker the color, the larger the m. The blue traces are the noise power spectra without modulation. We can get the signal power and the noise power from the blue trace and peak of the red trace. (I) Conventional QDC. (II) HG mode MQDC. (III) HG mode and frequency side mode MQDC.
    Results of channel capacity with different schemes. (a) The channel capacity as functions of the average photon number in the channel. (b) Detailed comparison of the channel capacity. Shown are coherent state channel Cch; Holevo bound of a single-mode bosonic channel CFock; the optimum single-mode dense coding channel Csdopt; single dense coding channel Csd, twofold multiplexing Cdd, and sixfold multiplexing channel Cxd with measured entanglement degree. The error bars are obtained from the propagation of statistical errors according to theoretical formulas. The amount of information is measured in nat =(1/ln 2) bit.
    Fig. 6. Results of channel capacity with different schemes. (a) The channel capacity as functions of the average photon number in the channel. (b) Detailed comparison of the channel capacity. Shown are coherent state channel Cch; Holevo bound of a single-mode bosonic channel CFock; the optimum single-mode dense coding channel Csdopt; single dense coding channel Csd, twofold multiplexing Cdd, and sixfold multiplexing channel Cxd with measured entanglement degree. The error bars are obtained from the propagation of statistical errors according to theoretical formulas. The amount of information is measured in nat =(1/ln2) bit.
    Analysis and control of optimal detuning condition. (a) Correlation noise power with the varying detuning of down-converted mode pair σ=0.365 and η=0.83. ΔA(B) denotes the normalized detuning of the down-converted mode. The position of the white star is our working point ΔA=−ΔB=0.45. (b) Experimental observation of cavity modes resonance state under the same working condition of the OPO. It gets the optimal detuning condition when locking the OPO with a 45° linear polarization HG1045° seed beam.
    Fig. 7. Analysis and control of optimal detuning condition. (a) Correlation noise power with the varying detuning of down-converted mode pair σ=0.365 and η=0.83. ΔA(B) denotes the normalized detuning of the down-converted mode. The position of the white star is our working point ΔA=ΔB=0.45. (b) Experimental observation of cavity modes resonance state under the same working condition of the OPO. It gets the optimal detuning condition when locking the OPO with a 45° linear polarization HG1045° seed beam.
    Hui Guo, Na Liu, Zhi Li, Rongguo Yang, Hengxin Sun, Kui Liu, Jiangrui Gao. Generation of continuous-variable high-dimensional entanglement with three degrees of freedom and multiplexing quantum dense coding[J]. Photonics Research, 2022, 10(12): 2828
    Download Citation