• Photonics Research
  • Vol. 9, Issue 9, 1699 (2021)
Zhe Zhang1, Leona Nest1、2, Suo Wang1, Si-Yi Wang1, and Ren-Min Ma1、3、4、*
Author Affiliations
  • 1State Key Laboratory for Mesoscopic Physics, School of Physics, Peking University, Beijing 100871, China
  • 2Department of Physics, Free University Berlin, Berlin 14195, Germany
  • 3Frontiers Science Center for Nano-optoelectronics & Collaborative Innovation Center of Quantum Matter, Beijing 100871, China
  • 4Yangtze Delta Institute of Optoelectronics, Peking University, Nantong 226010, China
  • show less
    DOI: 10.1364/PRJ.431612 Cite this Article Set citation alerts
    Zhe Zhang, Leona Nest, Suo Wang, Si-Yi Wang, Ren-Min Ma. Lasing-enhanced surface plasmon resonance spectroscopy and sensing[J]. Photonics Research, 2021, 9(9): 1699 Copy Citation Text show less
    Surface plasmon polaritons (SPPs) characteristics. (a) Metal–dielectric interface with complex permittivities ε1 and ε2, respectively. The interface lies in the x−y plane. (b)–(d) Real parts of Ex, Ez, and Hy transverse-magnetic wave components at a gold–glass interface (with ε1=−25+1.44i, and n2 =1.32, respectively), and an incident wavelength of λ=800 nm. (e) Real part of SPP dispersion relation ω(β) (blue line) for lossless metal, i.e., ε1∈R. The angular frequency is normalized to the plasma frequency ωp. The SPP’s propagation constant β is normalized to kp=ωp/c. For increasing propagation constant, the angular frequency approaches the surface plasmon frequency ωSP=ωp/1+ε2. The light curve in air is shown as the red line. (f) Real part of SPP dispersion relation at a silver–air interface (blue line). Here, ohmic loss is included, which causes the dispersion relation to “bend back” across the light line (red line).
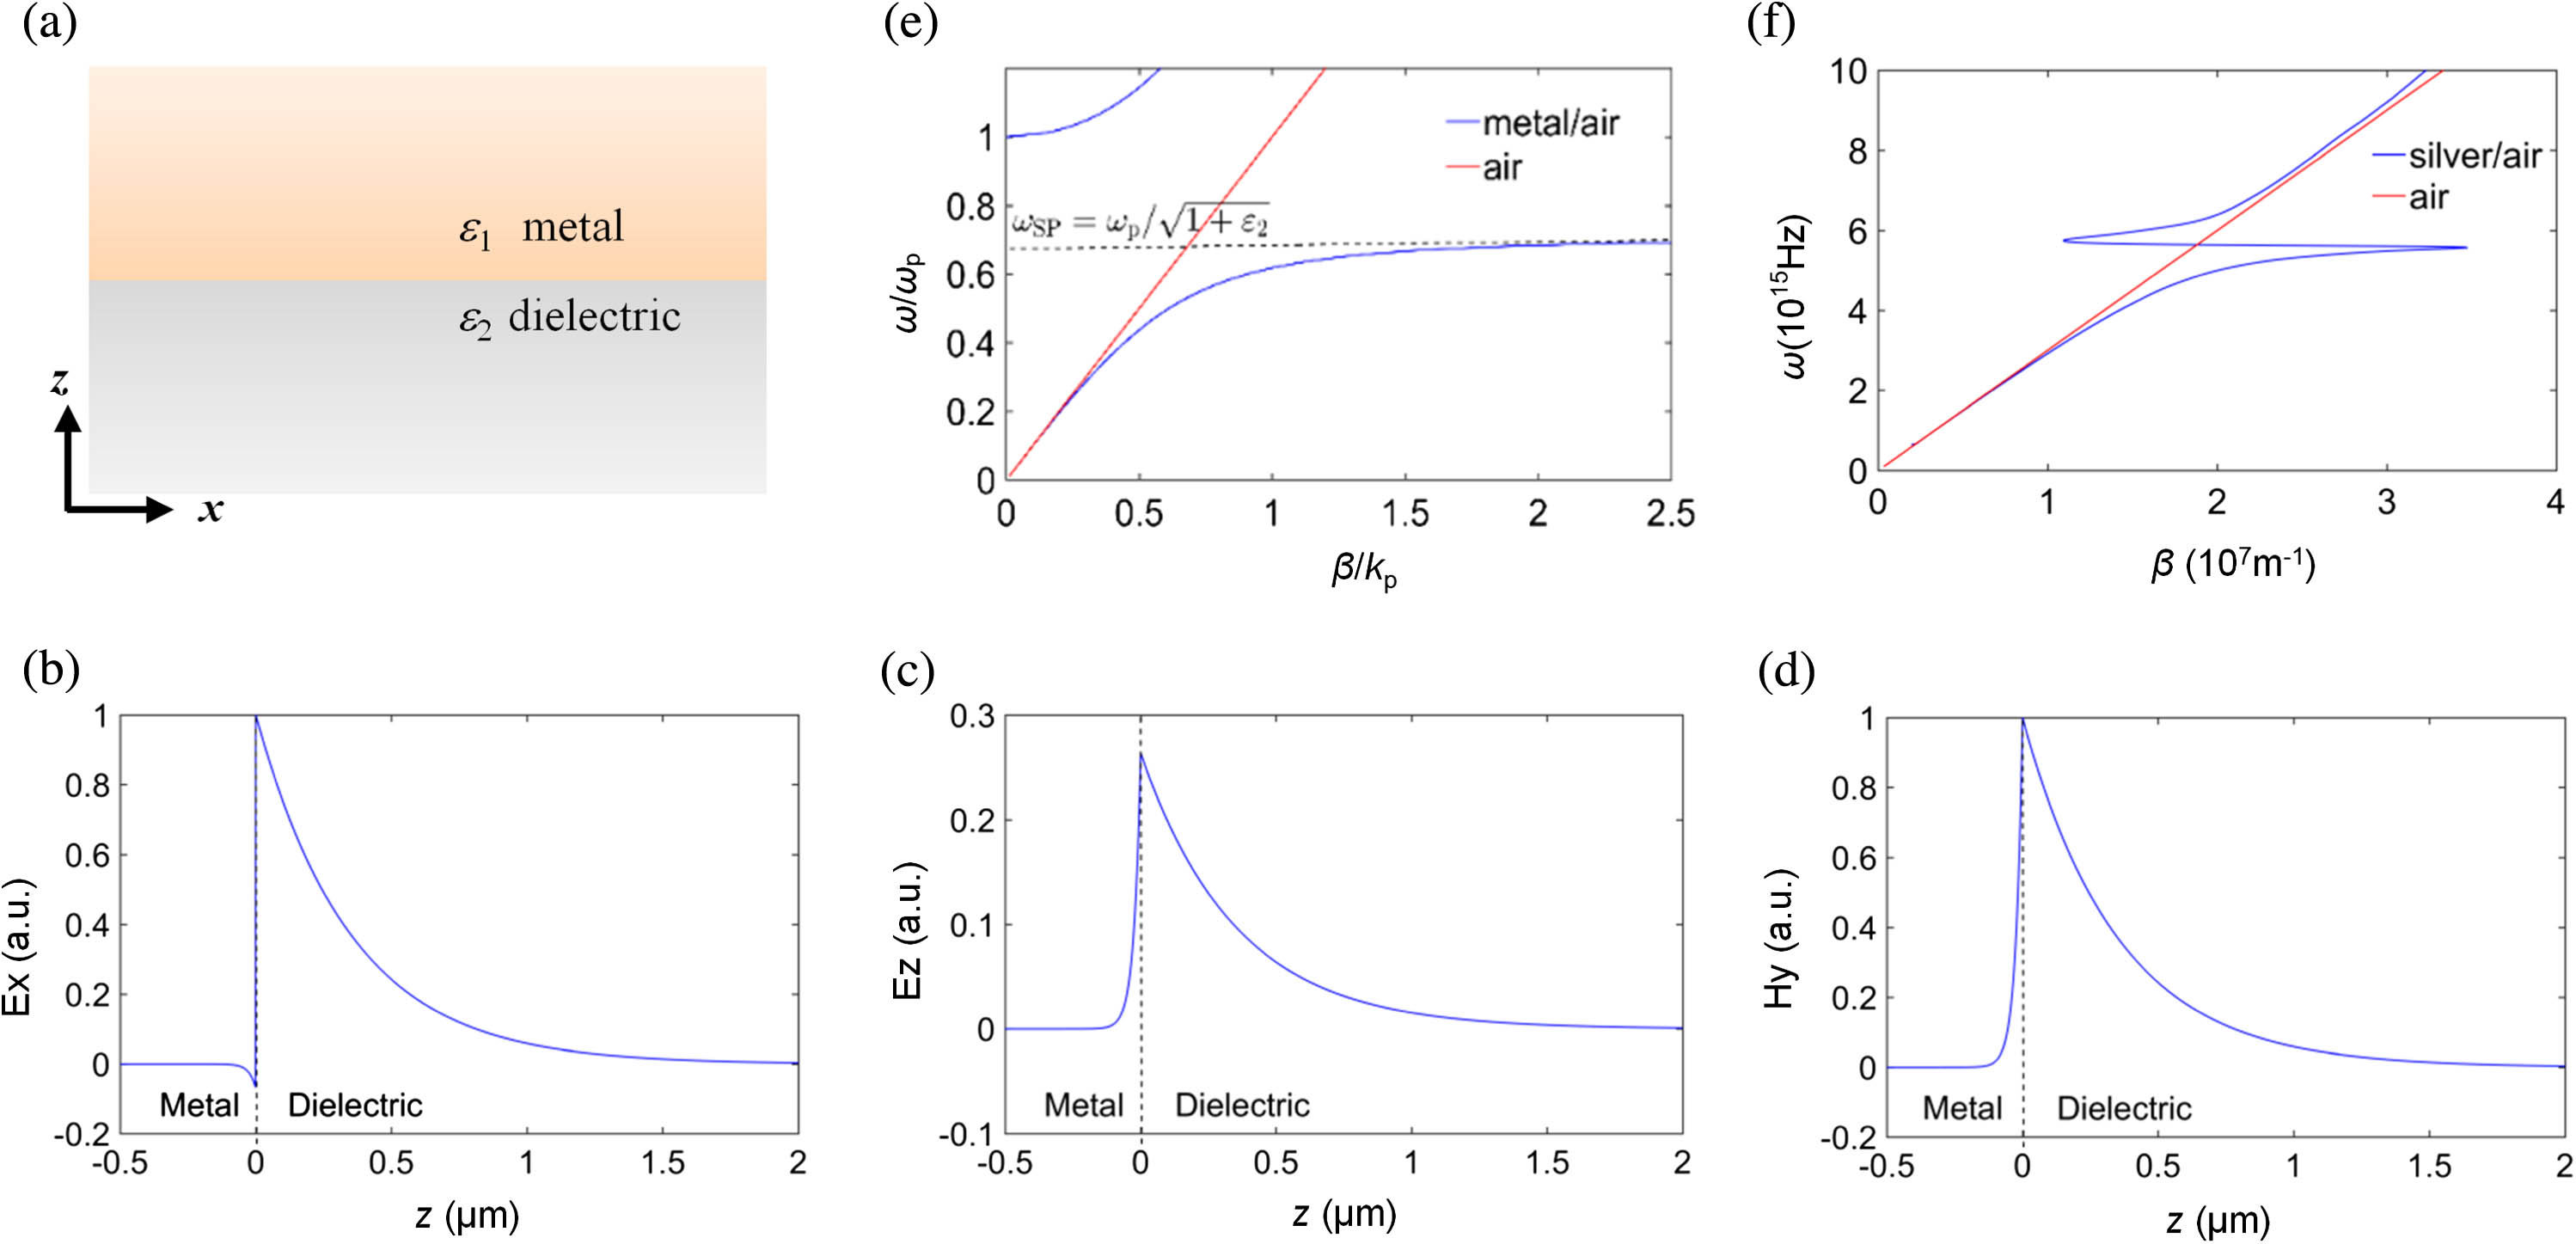
    Fig. 1. Surface plasmon polaritons (SPPs) characteristics. (a) Metal–dielectric interface with complex permittivities ε1 and ε2, respectively. The interface lies in the xy plane. (b)–(d) Real parts of Ex, Ez, and Hy transverse-magnetic wave components at a gold–glass interface (with ε1=25+1.44i, and n2=1.32, respectively), and an incident wavelength of λ=800  nm. (e) Real part of SPP dispersion relation ω(β) (blue line) for lossless metal, i.e., ε1R. The angular frequency is normalized to the plasma frequency ωp. The SPP’s propagation constant β is normalized to kp=ωp/c. For increasing propagation constant, the angular frequency approaches the surface plasmon frequency ωSP=ωp/1+ε2. The light curve in air is shown as the red line. (f) Real part of SPP dispersion relation at a silver–air interface (blue line). Here, ohmic loss is included, which causes the dispersion relation to “bend back” across the light line (red line).
    (a) Gain-enhanced SPR resonance. SPPs at a metal–dielectric interface (Kretschmann configuration) excited by an electromagnetic wave with wave vector k, with |k|=ωn0/c. The projection onto the interface is kx=|k|sin θ. When kx equals the SPP’s propagation constant β, phase matching is accomplished, resulting in a minimum of the angle-dependent reflectivity R(θ). (b) Reflectivity R in dependence of incidence angle θ and gain coefficient for an incidence wavelength of 650 nm, obtained analytically via Fresnel multilayer reflection theory. (c) Angle-dependent reflectivity for three different gain values. The analytical results (solid lines) are in agreement with our full-wave simulation (dotted line). (d) FWHM of the angle-dependent reflectivity as a function of the gain coefficient obtained from simulation (red dots) and analysis (blue line). (e) Wavelength-dependent reflectivity for three different gain values [corresponding to (c)] at a fixed incidence angle of 70.75 deg. (f) FWHM of wavelength-dependent reflectivity as a function of the gain coefficient obtained from simulation (red dots) and analysis (blue line).
    Fig. 2. (a) Gain-enhanced SPR resonance. SPPs at a metal–dielectric interface (Kretschmann configuration) excited by an electromagnetic wave with wave vector k, with |k|=ωn0/c. The projection onto the interface is kx=|k|sinθ. When kx equals the SPP’s propagation constant β, phase matching is accomplished, resulting in a minimum of the angle-dependent reflectivity R(θ). (b) Reflectivity R in dependence of incidence angle θ and gain coefficient for an incidence wavelength of 650 nm, obtained analytically via Fresnel multilayer reflection theory. (c) Angle-dependent reflectivity for three different gain values. The analytical results (solid lines) are in agreement with our full-wave simulation (dotted line). (d) FWHM of the angle-dependent reflectivity as a function of the gain coefficient obtained from simulation (red dots) and analysis (blue line). (e) Wavelength-dependent reflectivity for three different gain values [corresponding to (c)] at a fixed incidence angle of 70.75 deg. (f) FWHM of wavelength-dependent reflectivity as a function of the gain coefficient obtained from simulation (red dots) and analysis (blue line).
    Lasing-enhanced surface plasmon resonance (LESPR) sensor. (a) Schematic of an LESPR sensor setup. A plasmonic nanolaser is surrounded by the liquid analyte, where the refractive index change of the analyte will shift the lasing emission wavelength. LESPR sensor has a much narrower spectral linewidth than an SPR sensor. (b) A schematic showing that, for a given resonance peak shift, the LESPR sensor has a much larger intensity change than an SPR sensor. Figure adapted [24].
    Fig. 3. Lasing-enhanced surface plasmon resonance (LESPR) sensor. (a) Schematic of an LESPR sensor setup. A plasmonic nanolaser is surrounded by the liquid analyte, where the refractive index change of the analyte will shift the lasing emission wavelength. LESPR sensor has a much narrower spectral linewidth than an SPR sensor. (b) A schematic showing that, for a given resonance peak shift, the LESPR sensor has a much larger intensity change than an SPR sensor. Figure adapted [24].
    LESPR sensor for refractive index sensing. (a) SEM image of an LESPR sensor. (b) Lasing emission from the LESPR sensor with ethanol (olive) and propyl alcohol (red) as analyte. The spectrum shifts in response to a refractive index change of Δn=0.0213. (c) Intensity detection figure of merit FOMI in dependence of wavelength. The maximum FOMI amounts to ≈84,000. Figure adapted [24].
    Fig. 4. LESPR sensor for refractive index sensing. (a) SEM image of an LESPR sensor. (b) Lasing emission from the LESPR sensor with ethanol (olive) and propyl alcohol (red) as analyte. The spectrum shifts in response to a refractive index change of Δn=0.0213. (c) Intensity detection figure of merit FOMI in dependence of wavelength. The maximum FOMI amounts to 84,000. Figure adapted [24].
    High-yield plasmonic nanolasers with superior stability for sensing in aqueous solution. (a), (b) Continuous trace of emission spectra of CdSe nanosquare plasmonic nanolasers without and with an Al2O3 passivation layer, respectively. (c) Yield of CdSe nanosquare plasmonic nanolasers without and with Al2O3 passivation. Only 4.1% of 73 tested devices without surface passivation showed stable lasing. Contrarily, 68.2% of 85 passivated devices exhibited stable lasing over 3600 s of measuring. Figure adapted [71].
    Fig. 5. High-yield plasmonic nanolasers with superior stability for sensing in aqueous solution. (a), (b) Continuous trace of emission spectra of CdSe nanosquare plasmonic nanolasers without and with an Al2O3 passivation layer, respectively. (c) Yield of CdSe nanosquare plasmonic nanolasers without and with Al2O3 passivation. Only 4.1% of 73 tested devices without surface passivation showed stable lasing. Contrarily, 68.2% of 85 passivated devices exhibited stable lasing over 3600 s of measuring. Figure adapted [71].
    Plasmonic nanolasers with a nanotrench defect cavity for sensing applications. (a) Schematic of a plasmonic nanolaser with a nanotrench defect. (b) Schematic of the plasmonic nanolaser with a nanotrench defect for glucose solution sensing. (c), (d) Side view of resonant mode profiles |E| at cavity depths hc of 10 and 90 nm, respectively. (e) Sensitivity for different cavity depths in a glucose solution. Figure adapted [72].
    Fig. 6. Plasmonic nanolasers with a nanotrench defect cavity for sensing applications. (a) Schematic of a plasmonic nanolaser with a nanotrench defect. (b) Schematic of the plasmonic nanolaser with a nanotrench defect for glucose solution sensing. (c), (d) Side view of resonant mode profiles |E| at cavity depths hc of 10 and 90 nm, respectively. (e) Sensitivity for different cavity depths in a glucose solution. Figure adapted [72].
    Plasmonic laser based on a metallic trench Fabry–Perot resonator. (a) Schematic of the device consisting of a silver trench. The cavity floor of length l0 features a sinusoidal grating of periodicity p and height d, with respect to the cavity floor. The grating is offset from the cavity center by ξ. The grated cavity floor is coated with PMMA:DCM as the gain medium. A recessed slit, offset from the cavity center by ζ′′, evanescently samples the lasing SPP mode and transmits a wave of proportional intensity IE into the far field. (b) SEM image of the cavity illustrating the grating-decorated cavity floor. Inset: top-view SEM image of the device, where the nominal location of the buried recessed sampling slit is indicated by the dotted black line. (c) FDTD-simulated cross section of magnetic field intensity at the center of the lasing cavity coated with layers of gain medium with respective thicknesses of 50 and 260 nm. (d) FDTD-simulated lasing wavelength shifts of passive cavity (dye-free), 50 and 260 nm coated active cavity. Figure adapted [85].
    Fig. 7. Plasmonic laser based on a metallic trench Fabry–Perot resonator. (a) Schematic of the device consisting of a silver trench. The cavity floor of length l0 features a sinusoidal grating of periodicity p and height d, with respect to the cavity floor. The grating is offset from the cavity center by ξ. The grated cavity floor is coated with PMMA:DCM as the gain medium. A recessed slit, offset from the cavity center by ζ, evanescently samples the lasing SPP mode and transmits a wave of proportional intensity IE into the far field. (b) SEM image of the cavity illustrating the grating-decorated cavity floor. Inset: top-view SEM image of the device, where the nominal location of the buried recessed sampling slit is indicated by the dotted black line. (c) FDTD-simulated cross section of magnetic field intensity at the center of the lasing cavity coated with layers of gain medium with respective thicknesses of 50 and 260 nm. (d) FDTD-simulated lasing wavelength shifts of passive cavity (dye-free), 50 and 260 nm coated active cavity. Figure adapted [85].
    Plasmonic nanolaser for gas detection. (a) Schematic of the detector consisting of a semiconductor nanosquare on top of a silver/MgF2 substrate. (b) SEM image of the device. (c) Experimental setup. The active plasmon nanosensor is placed into a chamber with a gas inlet and outlet. Through a window the device is pumped, and the lasing emission is detected. (d) Lasing spectrum with the carrier gas only (black line) and with a concentration of 8 ppb (parts per billion) 2,4-dinitrotoluene (DNT) (red line). (e) Calibration curves for the analytes ammonium nitrate (AN), DNT, and nitrobenzene (NB) in air. The obtained detection limits are 0.4 ppb, 0.67 ppb, and 7.2 ppm for AN, DNT, and NB, respectively. Figure adapted [23].
    Fig. 8. Plasmonic nanolaser for gas detection. (a) Schematic of the detector consisting of a semiconductor nanosquare on top of a silver/MgF2 substrate. (b) SEM image of the device. (c) Experimental setup. The active plasmon nanosensor is placed into a chamber with a gas inlet and outlet. Through a window the device is pumped, and the lasing emission is detected. (d) Lasing spectrum with the carrier gas only (black line) and with a concentration of 8 ppb (parts per billion) 2,4-dinitrotoluene (DNT) (red line). (e) Calibration curves for the analytes ammonium nitrate (AN), DNT, and nitrobenzene (NB) in air. The obtained detection limits are 0.4 ppb, 0.67 ppb, and 7.2 ppm for AN, DNT, and NB, respectively. Figure adapted [23].
    Spaser as biological probes. (a) Spaser schematic. (b) Stimulated emission of spasers in suspension. Light–light curve (red) and emission linewidth in dependence of pump fluence (blue). At about 200 mJ/cm2 so-called “giant lasing” occurs. (c), (d) Fluorescence images of single (c) and multiple (d) folic-acid-conjugated spasers attached to a cancer cell. Figure adapted [91].
    Fig. 9. Spaser as biological probes. (a) Spaser schematic. (b) Stimulated emission of spasers in suspension. Light–light curve (red) and emission linewidth in dependence of pump fluence (blue). At about 200  mJ/cm2 so-called “giant lasing” occurs. (c), (d) Fluorescence images of single (c) and multiple (d) folic-acid-conjugated spasers attached to a cancer cell. Figure adapted [91].
    Spaser for ultranarrow bandwidth STED super-resolution imaging. (a) Principle of STED of spaser radiation. (b) Spectra of fluorescent dyes (dashed red line) and spaser nanoparticles (solid black line). Inset shows transmission electron microscope image of the spaser. (c) Confocal and (d) STED images of separated single spasers. (e) Intensity profile on the dashed magenta line (confocal) and solid line (STED) box. The fitted lines indicate the resolutions are 286 nm (confocal) and 74 nm (STED) by FWHM. (f) Measured resolution enhancement by increasing STED depletion power. Figure adapted [119].
    Fig. 10. Spaser for ultranarrow bandwidth STED super-resolution imaging. (a) Principle of STED of spaser radiation. (b) Spectra of fluorescent dyes (dashed red line) and spaser nanoparticles (solid black line). Inset shows transmission electron microscope image of the spaser. (c) Confocal and (d) STED images of separated single spasers. (e) Intensity profile on the dashed magenta line (confocal) and solid line (STED) box. The fitted lines indicate the resolutions are 286 nm (confocal) and 74 nm (STED) by FWHM. (f) Measured resolution enhancement by increasing STED depletion power. Figure adapted [119].
    Microdisk laser particles for cellular labeling and tracking. (a) SEM image of silica-coated CLPs. Top left: false-color cross-sectional SEM image of a coated microdisk cut with focused ion beam. (b) Confocal fluorescence image of mouse breast tumor (4T1) cells with staining for actin (magenta), and nucleus (green), overlaid with bright-field transmission image of LPs (gray scale). (c) Overlaid LASE-fluorescence image of LPs inside membrane-GFP-expressing human embryonic kidney (HEK-293) cells. Inset, zoomed-in images of three LPs, in which the color of each dot (pixel) represents the peak wavelength of laser emission. (d) SEM image of an array of OLPs on pillars. Top left: SEM image of an OLP after detachment. (e), (f) Slope efficiency versus orientation angle α of CLP (e) and OLP (f) ensembles. (a)–(c) adapted [121], (d)–(f) adapted [122].
    Fig. 11. Microdisk laser particles for cellular labeling and tracking. (a) SEM image of silica-coated CLPs. Top left: false-color cross-sectional SEM image of a coated microdisk cut with focused ion beam. (b) Confocal fluorescence image of mouse breast tumor (4T1) cells with staining for actin (magenta), and nucleus (green), overlaid with bright-field transmission image of LPs (gray scale). (c) Overlaid LASE-fluorescence image of LPs inside membrane-GFP-expressing human embryonic kidney (HEK-293) cells. Inset, zoomed-in images of three LPs, in which the color of each dot (pixel) represents the peak wavelength of laser emission. (d) SEM image of an array of OLPs on pillars. Top left: SEM image of an OLP after detachment. (e), (f) Slope efficiency versus orientation angle α of CLP (e) and OLP (f) ensembles. (a)–(c) adapted [121], (d)–(f) adapted [122].
    Zhe Zhang, Leona Nest, Suo Wang, Si-Yi Wang, Ren-Min Ma. Lasing-enhanced surface plasmon resonance spectroscopy and sensing[J]. Photonics Research, 2021, 9(9): 1699
    Download Citation