• Spectroscopy and Spectral Analysis
  • Vol. 41, Issue 10, 3311 (2021)
Refat Moamen S.1、1; *;, Salman Mahmoud2、2;, El-Didamony Akram M.3、3;, Fetooh Hammad3、3;, Abd El-Maksoud Eman S.E.3、3;, and El-Sayed Mohamed Y.3、3; 4;
Author Affiliations
  • 11. Department of Chemistry, College of Science, Taif University, P.O. Box 11099, Taif 21944, Saudi Arabia
  • 22. Department of Chemistry, Faculty of Science, Al-Hussein Bin Talal University, P.O. Box 20 Ma’an, Jordan
  • 33. Department of Chemistry, Faculty of Science, Zagazig University, Egypt
  • show less
    DOI: 10.3964/j.issn.1000-0593(2021)10-3311-05 Cite this Article
    Refat Moamen S., Salman Mahmoud, El-Didamony Akram M., Fetooh Hammad, Abd El-Maksoud Eman S.E., El-Sayed Mohamed Y.. Spectroscopic and Fluorescence Studies on the Trivalent Ce, Eu, Nd and La Metal Ions Rhodamine C Florescent Dye Complexes[J]. Spectroscopy and Spectral Analysis, 2021, 41(10): 3311 Copy Citation Text show less
    Structure of Rhodamine C (RHC)
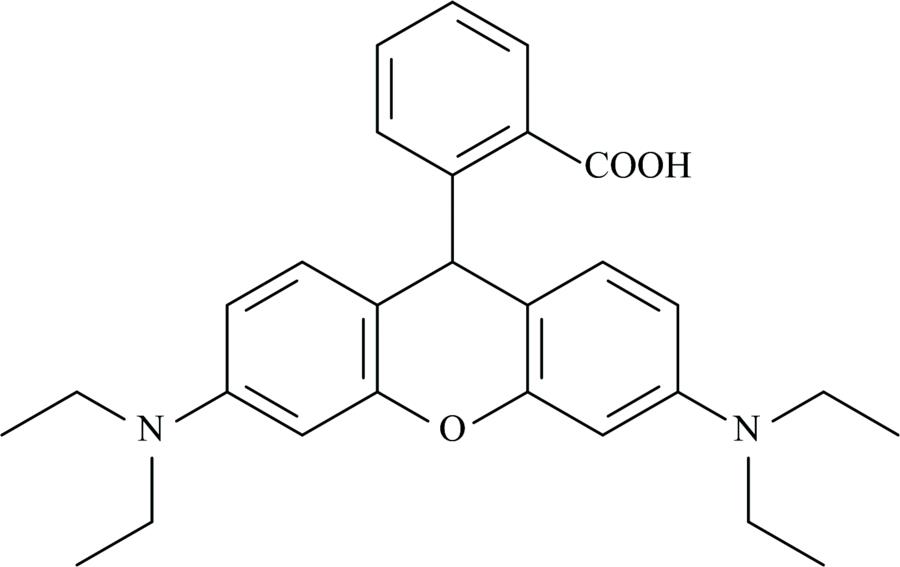
    Fig. 1. Structure of Rhodamine C (RHC)
    Statistical representation for antibacterial and antifungal activities of the synthesized complexes
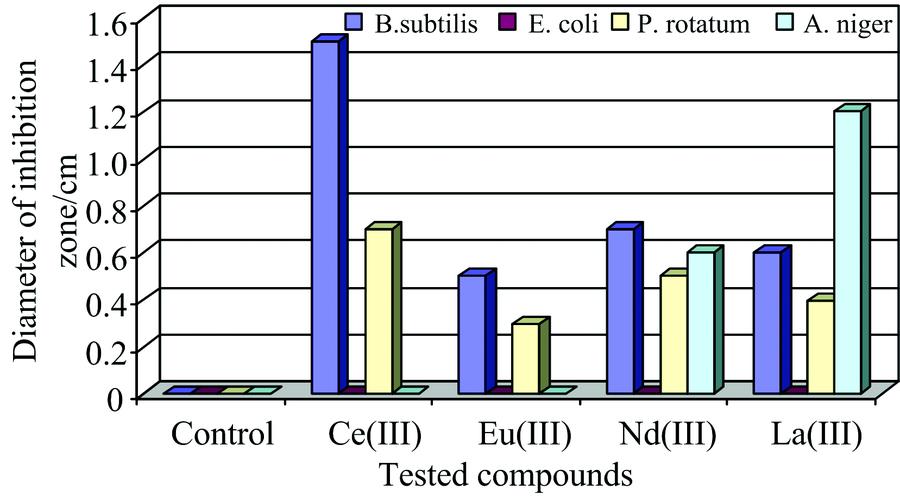
    Fig. 2. Statistical representation for antibacterial and antifungal activities of the synthesized complexes
    Modes of the chelation of RHC complexes (where M=Eu(Ⅲ), La(Ⅲ), Nd(Ⅲ) and Ce(Ⅲ), and X=2, 3, 4 and 5, respectively)
    Fig. 3. Modes of the chelation of RHC complexes (where M=Eu(Ⅲ), La(Ⅲ), Nd(Ⅲ) and Ce(Ⅲ), and X=2, 3, 4 and 5, respectively)
    Excitation and emission spectra of rhodamine Ca: Excitation spectrum (λem=508 nm); b: Emission spectrum (λex=550 nm)
    Fig. 4. Excitation and emission spectra of rhodamine C
    a: Excitation spectrum (λem=508 nm); b: Emission spectrum (λex=550 nm)
    Fluorescence spectra of rhodamine C in absence and presence of varying concentration of Gd3+(λex=550 nm)a: Without Gd3+; b: 2×10⁻⁵ mol·L-2; c: 4×10⁻⁵ mol·L-1
    Fig. 5. Fluorescence spectra of rhodamine C in absence and presence of varying concentration of Gd3+(λex=550 nm)
    a: Without Gd3+; b: 2×10⁻⁵ mol·L-2; c: 4×10⁻⁵ mol·L-1
    Fluorescence spectra of rhodamine C in absence and presence of varying concentration of La3+ (λex=550 nm)a: Without La3+; b: 2×10⁻⁵ mol·L-2; c: 4×10⁻⁵ mol·L-1
    Fig. 6. Fluorescence spectra of rhodamine C in absence and presence of varying concentration of La3+ (λex=550 nm)
    a: Without La3+; b: 2×10⁻⁵ mol·L-2; c: 4×10⁻⁵ mol·L-1
    Fluorescence spectra of rhodamine C in absence and presence of varying concentration of Ce3+ (λex=550 nm)a: Without Ce3+; b: 2×10⁻⁵ mol·L-2; c: 4×10⁻⁵ mol·L-1
    Fig. 7. Fluorescence spectra of rhodamine C in absence and presence of varying concentration of Ce3+ (λex=550 nm)
    a: Without Ce3+; b: 2×10⁻⁵ mol·L-2; c: 4×10⁻⁵ mol·L-1
    Fluorescence spectra of rhodamine C in absence and presence of varying concentration of Tb3+ (λex=550 nm)a: Without Tb3+; b: 2×10⁻⁵ mol·L-2; c: 4×10⁻⁵ mol·L-1
    Fig. 8. Fluorescence spectra of rhodamine C in absence and presence of varying concentration of Tb3+ (λex=550 nm)
    a: Without Tb3+; b: 2×10⁻⁵ mol·L-2; c: 4×10⁻⁵ mol·L-1
    Fluorescence spectra of rhodamine C in absence and presence of varying concentration of Th4+ (λex=550 nm)a: Without Th3+; b: 2×10⁻⁵ mol·L-2; c: 4×10⁻⁵ mol·L-1
    Fig. 9. Fluorescence spectra of rhodamine C in absence and presence of varying concentration of Th4+ (λex=550 nm)
    a: Without Th3+; b: 2×10⁻⁵ mol·L-2; c: 4×10⁻⁵ mol·L-1
    ComplexesColorContent ((calculated) found)ΛM/
    -1·cm2·mol-1)
    %C%H%N%M
    [Ce(RHC)(NO3)2]·5H2OBright
    yellow
    (41.94)
    41.36
    (4.36)
    4.41
    (6.99)
    6.36
    (17.47)
    17.90
    19
    [Eu(RHC)(NO3)2]·2H2ODark
    yellow
    (44.26)
    44.50
    (4.61)
    4.49
    (7.37)
    7.23
    (20.02)
    20.42
    15
    [Nd(RHC)(NO3)2]·4H2OOrange(42.69)
    42.88
    (4.44)
    4.23
    (7.11)
    7.21
    (18.55)
    18.41
    9
    [La(RHC)(NO3)2]·3H2OReddish
    brown
    (43.97)
    43.33
    (4.58)
    4.28
    (7.32)
    7.69
    (18.19)
    18.57
    14
    Table 1. Elemental and physical data of Rhodamine C metal complexes
    Complexesνas(COO-)νs(COO-)Δν(C=O), COOHν(M—O)
    RHC1 5881 3382501 704-
    Ce(Ⅲ)complex1 6011 399202-476, 550
    Eu(Ⅲ)complex1 5971 385212-568,496
    Nd(Ⅲ)complex1 5991 383216-532, 474
    La(Ⅲ)complex1 5981 383215-564, 480
    Table 2. IR Frequencies of RHC and the Ce(Ⅲ), Eu(Ⅲ), Nd(Ⅲ), and La(Ⅲ) complexes
    Tested compoundsDiameter of inhibition zone/cm
    B.subtilisE. coliP. rotatumA. niger
    Control (DMSO)0000
    Ce(Ⅲ) complex1.500.70
    Eu(Ⅲ) complex0.500.30
    Nd(Ⅲ) complex0.700.50.6
    La(Ⅲ) complex0.600.41.2
    Table 3. Antimicrobial activity of the synthesized complexes
    Refat Moamen S., Salman Mahmoud, El-Didamony Akram M., Fetooh Hammad, Abd El-Maksoud Eman S.E., El-Sayed Mohamed Y.. Spectroscopic and Fluorescence Studies on the Trivalent Ce, Eu, Nd and La Metal Ions Rhodamine C Florescent Dye Complexes[J]. Spectroscopy and Spectral Analysis, 2021, 41(10): 3311
    Download Citation