
Refat Moamen S., Salman Mahmoud, El-Didamony Akram M., Fetooh Hammad, Abd El-Maksoud Eman S.E., El-Sayed Mohamed Y.. Spectroscopic and Fluorescence Studies on the Trivalent Ce, Eu, Nd and La Metal Ions Rhodamine C Florescent Dye Complexes[J]. Spectroscopy and Spectral Analysis, 2021, 41(10): 3311
- Spectroscopy and Spectral Analysis
- Vol. 41, Issue 10, 3311 (2021)
Abstract
Introduction
Laser dyes are very versatile[
Many researchers have prepared and designed several derivatives used as rhodamine-labeled oligonucleotides[
1 Experimental
1.1 Instrumental analyses
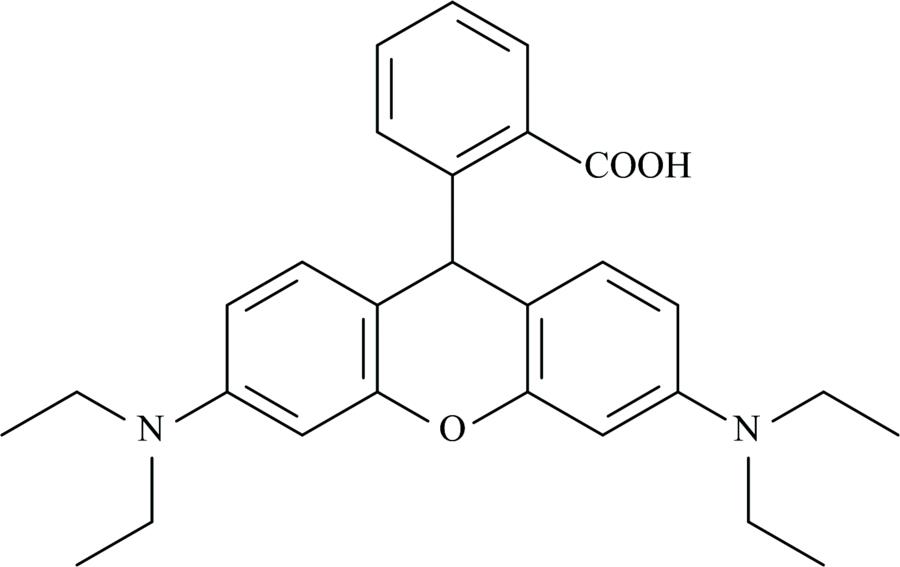
Rhodamine C (Fig.1) was purchased from Aldrich Company. Melting points were determined on a digital apparatus. The elemental analysis of C, N, and H were carried out with a Perkin-Elmer CHN 2400. Molar conductivities of solutions in SMSO solvent (10-3 mol·L-1) were determined with a Jenway 4010 conductivity meter. The electronic absorption spectra of solutions in DMSO solvent (10-3 mol·L-1) were measured with a Jenway 6405 spectrophotometer in the range 200~800 nm using 1 cm quartz cell. The infrared spectra of the products were collected on a Brüker FT-IR spectrophotometer within the range of 4 000~400 cm-1 using KBr discs. 1H NMR spectra were obtained using a Varian Gemini 200 MHz spectrometer at room temperature using tetramethylsilane (TMS) as the internal reference and dimethylsulfoxide, d6 (DMSO-d6) as the solvent. The metal content was obtained gravimetrically by converting the metal complexes to their corresponding metal oxides.
![]()
Figure 1.Structure of Rhodamine C (RHC)
1.2 Microbiological investigation
The isolates of fungi and bacteria were seeded in tubes containing nutrient Dox’s broth (DB) and broth (NB), respectively. One ml of the seeded (DB) for fungi was homogenized in a tube containing 9 mL of melted nutrient agar (DA) at 45 ℃, while 1 mL of the seeded (NB) for bacteria was homogenized in a tube containing 9 mL of melted nutrient agar (NA) at 45 ℃. The resultant suspensions were poured into Petri dishes, and the dishes were left to cool. After cooling, holes with a diameter of 0.5 cm were done, then 100 μL of the investigated complexes were added to these holes using a micropipette. The dishes were incubated in an incubator at 28 ℃ for fungi and 37 ℃ for bacteria for 24 hours. Diameters of the inhibition zone were obtained and expressed in cm. The antimicrobial activities of the investigated metal complexes as well as the pure solvent as a blank test were tested against two kinds of fungi; Aspergillus niger and Penicillium rotatum, and two kinds of bacteria; Escherichia Coli as (Gram -ve) and Bacillus subtilis as (Gram +ve).
1.3 Syntheses
The Ce(Ⅲ), Eu(Ⅲ), Nd(Ⅲ) and La(Ⅲ) nitrates (1 mmol) were dissolved in 10 mL 99% methyl alcohol A.R. The nitrate solutions were added slowly to a solution containing 1 mmol of RHC in 20 ml methyl alcohol. The pH was adjusted at pH 7~9 using 0.1 mol·L-1 NH4OH solution. The mixtures were stirred on a magnetic stirrer with refluxing at 60~70 ℃ for one 60 minutes. Then, the mixtures were left to evaporate slowly at room temperature to produce the products. The formed products were filtered off, washed with hot solvent several times to obtain pure products, and dried under vacuum over anhydrous CaCl2.
2 Results and discussion
2.1 Molar conductivity
The formation mechanism of RHC complexes can be summarized as following: M(NO3)3·nH2O+RHC(HL)+NH4OH→[M(L)(NO3)2]·nH2O+NH4NO3+nH2O(where, M=Eu(Ⅲ), La(Ⅲ), Nd(Ⅲ) and Ce(Ⅲ); n=2, 3, 4 and 5, respectively).
Values of the molar conductivity for the Ce(Ⅲ), Eu(Ⅲ), Nd(Ⅲ) and La(Ⅲ) complexes of rhodamine C in DMSO solvent (10-3 mol·L-1) are listed in Table 1. The values are in the range from 9 to 19 Ω-1·cm2·mol-1, which indicate the synthesized complexes are non-electrolytes[
2.2 IR spectral studies
The main infrared bands are summarized in Table 2. The very strong absorption band located at 1 704 cm-1 in the IR spectrum of free Rhodamine C, is assigned to the ν(C=O) for the free ketone of the carboxylic group. This band was no longer observed in the spectra of the Ce(Ⅲ), Eu(Ⅲ), Nd(Ⅲ) and La(Ⅲ) complexes. In the IR spectra of the complexes, the bands observed at the range of 1 597~1 601 and 1 383~1 399 cm-1 are assigned to νas(COO-) and νs(COO-), respectively. The shift in the frequency values of νs(COO-) and νas(COO-) concerning the free carboxylate ion depends on the coordination mode of the (COO-) group with the metal ion[
2.3 Electronic absorption spectra
The complexes exhibit two characteristics absorption peaks at the ranges 350~500 and 215~340 nm, which are attributed to n—π* and π—π* transitions of the organic rhodamine C moiety, respectively. The synthesized complexes exhibit a bathochromic shift in their spectra compared with the free ligand within n—π* transition region. This shift is due to the change in the electronic configuration and the place of complexation for the obtained complexes.
2.4 1H-NMR spectra
The 1H-NMR spectra of the Eu(Ⅲ) and Nd(Ⅲ) complexes, respectively. The signal of the carboxylate OH which observed at δ=11 ppm in the spectrum of the free ligand, was disappeared in the spectra of the [Eu(RHC)(NO3)2]·2H2O and [La(RHC)(NO3)2]·3H2O complexes, indicating that the coordination between the RHC ligand and the M(Ⅲ) ions tacking place via the deprotonated carboxylic O group. The aromatic protons signals located at δ=6.00~8.00 ppm are present with decreasing intensities, due to different chemical environments. The signals at δ=3.58, 3.46 ppm [H, H2O] can be assigned for the water molecules of hydration.
2.5 Biology
The results of the antibacterial and the antifungal activities of the synthesized complexes are presented in Table 3, and Fig.2. All the complexes have no biological activity against E. coli, but in case of Aspergillus niger, La(Ⅲ) complex is more active than Nd(Ⅲ) complex. On the other hand, Ce(Ⅲ) and Eu(Ⅲ) complexes have no effect against Aspergillus niger. Generally, the orders of antimicrobial activity against B. subtilis and Penicillium rotatum for the different complexes are: Eu(Ⅲ)
![]()
Figure 2.Statistical representation for antibacterial and antifungal activities of the synthesized complexes
2.6 Proposed structure of the synthesized complexes
The structures of the synthesized complexes of RHC ligand with Ce(Ⅲ), Eu(Ⅲ), Nd(Ⅲ) and La(Ⅲ) ions have been established from the molar conductance, elemental analyses, UV-Vis, IR, and 1H-NMR spectra. Based on these techniques, octahedral geometries are proposed for the synthesized complexes as represented in Fig.3.
![]()
Figure 3.Modes of the chelation of RHC complexes (where M=Eu(Ⅲ), La(Ⅲ), Nd(Ⅲ) and Ce(Ⅲ), and
2.7 Fluorescence studies
Excitation and emission spectra of rhodamine C were recorded (Fig.4).
![]()
Figure 4.Excitation and emission spectra of rhodamine C
Metal ions of Ce3+, Tb3+, Th4+, Gd3+ and La3+ were found to quench the fluorescene intensity of rhodamine C in the aqueous state. The experimental results showed that the metal ions quench the fluorescence intensity of rhodamine C by forming dye-metal complexes (Figs.5—9). It was found that static quenching was the main reason of fluorescence quenching. Quenching can occur by a variety of molecular interactions, viz. excited-state reactions, molecular rearrangement, energy transfer and ground state complex formation (static quenching).
![]()
Figure 5.Fluorescence spectra of rhodamine C in absence and presence of varying concentration of Gd3+(
![]()
Figure 6.Fluorescence spectra of rhodamine C in absence and presence of varying concentration of La3+ (
![]()
Figure 7.Fluorescence spectra of rhodamine C in absence and presence of varying concentration of Ce3+ (
![]()
Figure 8.Fluorescence spectra of rhodamine C in absence and presence of varying concentration of Tb3+ (
![]()
Figure 9.Fluorescence spectra of rhodamine C in absence and presence of varying concentration of Th4+ (
References
[1] J Durate F. High Power Dye Laser, Springer-Verlag, Berlin(1991).
[2] J M G Matinho, M Beija, C A M Afonso. Chem. Soc. Rev., 38, 2410(2009).
[3] B Valeur. Developen of Rhodamine Dyes for Biochemical Application. In Molecular Fluorescence: Principle and Applications, Zhang L., et al, Eds.; Wiley-VCH, Weinheim(2002).
[4] T Mason W. Fluorescent and Luminescent Probes for Biological Activity, 2nd ed(1999).
[5] V A Ravi. Tetrahedron Let., 40, 7611(1999).
[6] T Raines R, S Chandran S, A Dickson K. J. Am. Chem. Soc., 127, 1652(2005).
[7] T Dooley C, J R Appel, A Houghten R. Bioorg. Med. Chem.Lett., 14, 1947(2004).
[8] Z Zhang H, X Cai S, J Guasella et al. Bioorg. Med. Chem. Lett., 11, 39(2001).
[9] P Leytus S, L Melhado L, W F Mangel. Biochem. J., 209, 299(1983).
[10] N Demas J, B A DeGraff. Chem. Educ., 74, 690(1997).
[11] Z Murtaza, E Terpetsching, R Lakowicz J et al. J. Fluoesc., 7, 17(1997).
[12] E Terpetschnig, R Laowicz J, H Szmacinski. Long-Lifetime Metal-Ligand Complexes as Probes in Biophysics and clinical Chemistry. In Methods in Enzymology, 278, 295(1997).
[13] R Ergashev, A Shakhverdov T. Opt. Spektros., 87, 236(1999).
[14] Z Li Y, Q Qu J, F Wang L et al. Synth. React. Inorg. Metal-Org. Nano-Met. Chem., 31, 1577(2001).
[15] H M A Killa, S Refat M, A F Mansour et al. J. Chem. Eng. Data, 56, 3493(2011).
[16] S Refat M, M El-Megharbel S, G Abd El-Wahed M. J. Mol. Struct., 892, 401(2008).
[17] M El-Megharbel S, S Refat M, G Abd El-Wahed M. Spectrochim. Acta A, 70, 916(2008).
[18] K Nakamoto. Infrared Spectra of Inorganic and Coordination Compound. John Wiley & Sons, New York(1968).

Set citation alerts for the article
Please enter your email address
© Copyright 2018-2021 | Chinese Laser Press. All Rights Reserved 沪ICP备15018463号-20