Author Affiliations
1Nanyang Technological University, School of Electrical and Electronic Engineering, Singapore2CINTRA UMI CNRS/NTU/THALES, Singapore3Nanyang Technological University, School of Chemical and Biomedical Engineering, Singaporeshow less
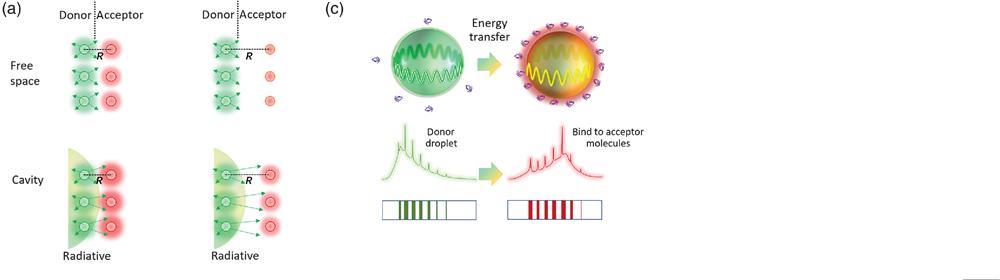
Fig. 1. (a) Comparison of nonradiative FRET and radiative energy transfer, with and without the cavity effect. Left panel: the distance () between donor and acceptor molecules is less than 6 nm. Right panel: the distance () between donor and acceptor molecules is far apart in free space. Red dots represent acceptor molecules; green dots represent donor molecules. (b) Time-resolved fluorescence lifetime measurement of Coumarin 6 (donor inside, 0.1 mM) microdroplet before (olive dots) and after adding (top panel) or (bottom panel) Rhodamine molecules (acceptor). When the acceptor concentration increases, the lifetime of the donor becomes faster. The FRET efficiency is around 26% and 3%, respectively. The solid curves were fitted by the scattered dots according to the exponential decay functions. (c) Schematic diagram interpreting cavity energy transfer and the photonic barcoding. The top panel illustrates WGM with and without the acceptor near the cavity boundary. The bottom panel shows the corresponding spectra and photonic barcodes before and after energy transfer. (d) A typical WGM-modulated fluorescent spectrum recorded from a Coumarin 6 donor-droplet (spectrum 1) before and after applying Rhodamine (spectrum 2). The excitation LED wavelength: 430 to 490 nm. The converted barcodes are plotted below. Droplet ; ; and .
Fig. 2. (a) and (b) Comparison between WGM emission spectra obtained from (a) Coumarin 6 microdroplet (with the donor in the cavity) and (b) pure microdroplet (without donor in the cavity) after adding Rhodamine (acceptor molecules). Different colors of spectra denote the time at which the spectrum was collected. The converted dynamic barcodes for respective time periods are plotted in the right panel for both cases under the same rule. The inset CCD images in (a) show the WGM MFL emission changes as the acceptor concentrations increase through time (the same droplet). Droplet ; ; and excitation LED wavelength: 430 to 490 nm. (c) Dynamic spectra of a Coumarin 6 microdroplet after adding Rhodamine from to 475 s. (d) Calculated energy transfer efficiency from (c) at different peaks: 527.4 nm (black dots), 547.6 nm (blue dots), and 559.8 nm (red dots) as a function of time. The solid line is fitted according to the data after 130 s.
Fig. 3. MFL spectra and the corresponding photonic barcodes under different cavity diameters of (a) 3.54, (b) 6.53, or (c) . All of the green curves (barcodes) represent Coumarin 6 droplets before binding to any acceptor molecules. All of the red curves (barcode) represent Coumarin 6 droplets after adding Rhodamine molecules. The insets show the fluorescence images captured by a monochromatic CCD (pseudocolor). All scale bars represent . In particular, modes were calculated according to the characteristic equation (see Supplementary Material). The excitation LED wavelength: 430 to 490 nm and .
Fig. 4. (a)–(d) Equilibrium WGM spectra of Coumarin 6 microdroplets before (green curve) and after (pink curve) adding (a) 500 nM, (b) , (c) , and (d) Rhodamine molecule solution. All WGM spectra were measured after reaching equilibrium under the same excitation wavelength (430 to 490 nm) and excitation energy. The fluorescence background was subtracted for clarity. (e) Photonic barcodes resulted from different Rhodamine concentrations [converted from the WGM spectra from (a)–(d)].
Fig. 5. (a) Schematic illustration of the Biotin-Atto 550 molecules binding to SA-coated microdroplet. (b) Normalized excitation (dashed line) and emission (solid line) spectra of BODIPY-R6G (green) and Atto 550 (red). (c) Comparison of the WGM spectra before and after adding 500 nM Biotin-Atto 550. The inset shows details of the spectral line. The corresponding photonic barcodes are plotted below. Excitation wavelength: 430 to 490 nm; droplet ; and BODIPY-R6G (donor) . The fluorescence background was subtracted for clarity.