
Zehang Ma, Rui Gong, Bin Li, Li Pei, Huai Wei. Optical Fiber Multi-Parameter Measurement Based on Machine Learning[J]. Acta Optica Sinica, 2022, 42(20): 2006003
- Acta Optica Sinica
- Vol. 42, Issue 20, 2006003 (2022)
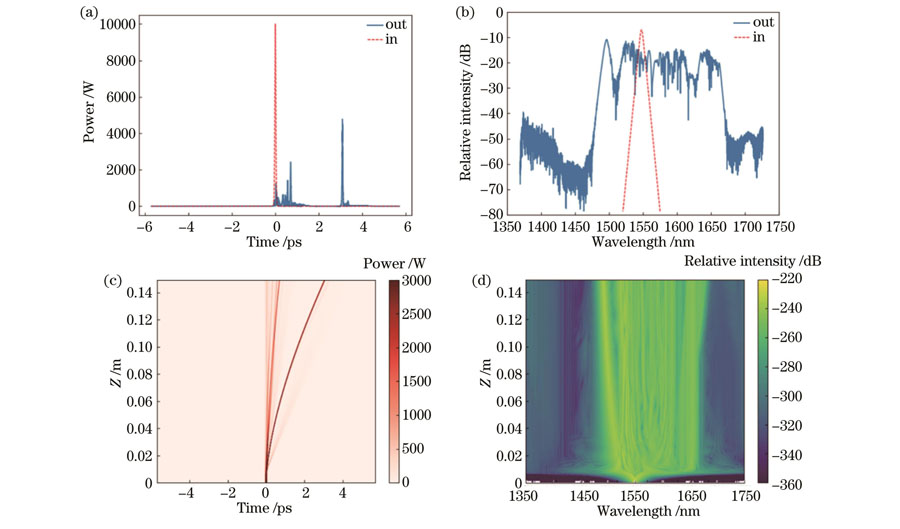
Fig. 1. Evolution of optical pulse in optical fiber. (a) Input and output power in time domain; (b) relative intensity of input and output power spectral density in frequency domain; (c) pulse evolution in time domain; (d) pulse evolution in frequency domain
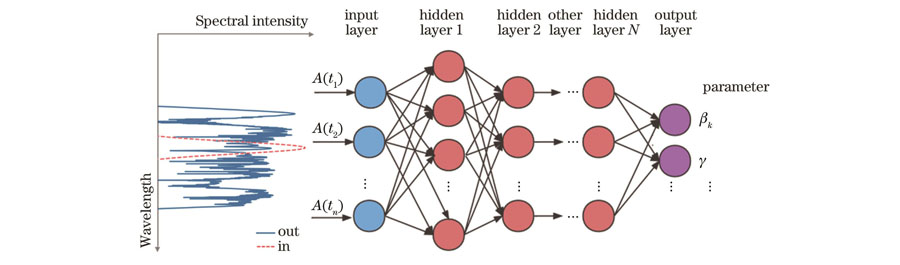
Fig. 2. Schematic of detecting fiber parameters using neural network
Fig. 3. Schematic of optical fiber parameter measurement using different methods. (a) Complete signal measurement method; (b) power spectrum measurement method
Fig. 4. Output spectra corresponding to input pulses with different peak powers. (a) 600 W; (b) 800 W; (c) 1000 W
Fig. 5. Structure diagram of convolutional neural network
Fig. 6. Measurement results of optical fiber parameters using all information in decision tree algorithm. (a) Measurement results of
Fig. 7. Measurement results of optical fiber parameters using all information in K-nearest neighbor algorithm. (a) Measurement results of
Fig. 8. Measurement results of optical fiber parameters using all information in random forest algorithm. (a) Measurement results of
Fig. 9. Measurement results of optical fiber parameters using all information in FCN algorithm. (a) Measurement results of
Fig. 10. Measurement results of optical fiber parameters using all information in CNN algorithm. (a) Measurement results of
Fig. 11. Measurement results of optical fiber parameters using power spectrum in decision tree algorithm. (a) Measurement results of
Fig. 12. Measurement results of optical fiber parameters using power spectrum in K-nearest neighbor algorithm. (a) Measurement results of
Fig. 13. Measurement results of optical fiber parameters using power spectrum in random forest algorithm. (a) Measurement results of
Fig. 14. Measurement results of optical fiber parameters using power spectrum in FCN algorithm. (a) Measurement results of
Fig. 15. Measurement results of optical fiber parameters using power spectrum in CNN algorithm. (a) Measurement results of
|
Table 1. Loss of five machine learning algorithms in test set

Set citation alerts for the article
Please enter your email address
© Copyright 2018-2021 | Chinese Laser Press. All Rights Reserved 沪ICP备15018463号-20