Jie Chen1、2, Kazuki Nitta2、3, Xin Zhao1, Takahiko Mizuno3、4、5, Takeo Minamikawa3、4、5、6, Francis Hindle7, Zheng Zheng1、8、*, and Takeshi Yasui3、4、5、6、*
Author Affiliations
1Beihang University, School of Electronic and Information Engineering, Beijing, China2Tokushima University, Graduate School of Advanced Technology and Science, Tokushima, Japan3JST, ERATO MINOSHIMA Intelligent Optical Synthesizer, Tokushima, Japan4Tokushima University, Institute of Post-LED Photonics, Tokushima, Japan5Tokushima University, Graduate School of Technology, Industrial and Social Sciences, Tokushima, Japan6Tokushima University, Research Cluster on “Multi-scale Vibrational Microscopy for Comprehensive Diagnosis and Treatment of Cancer”, Tokushima, Japan7Université du Littoral Côte d’Opale, Laboratoire de Physico-Chimie de l’Atmosphère, Dunkerque, France8Beihang University, Beijing Advanced Innovation Center for Big Data-based Precision Medicine, Beijing, Chinashow less
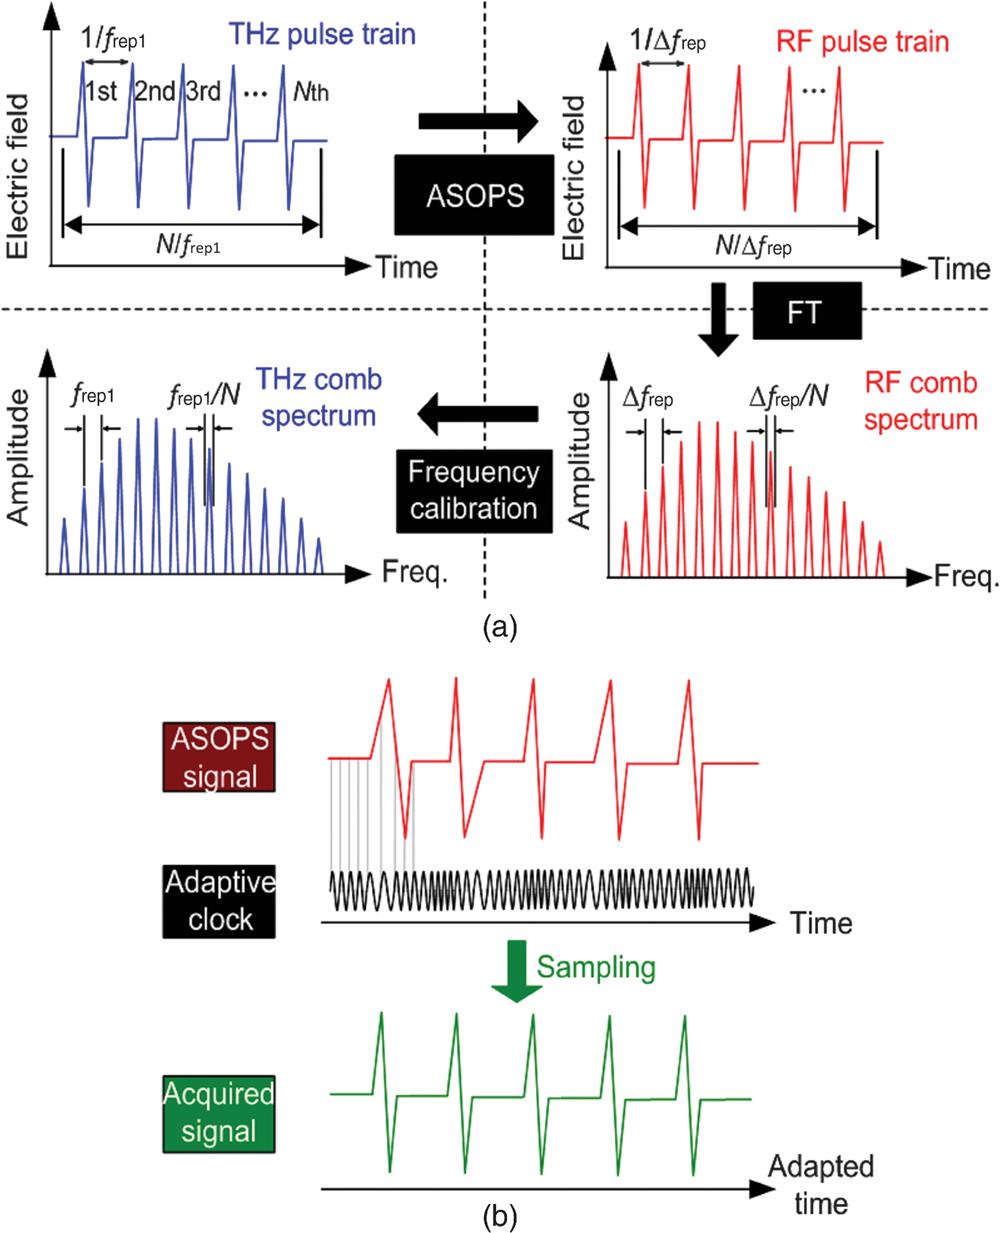
Fig. 1. Principle of operation. (a) Flowchart of time-domain THz-DCS. (b) Acquisition of the temporal waveform using the adaptive sampling method.
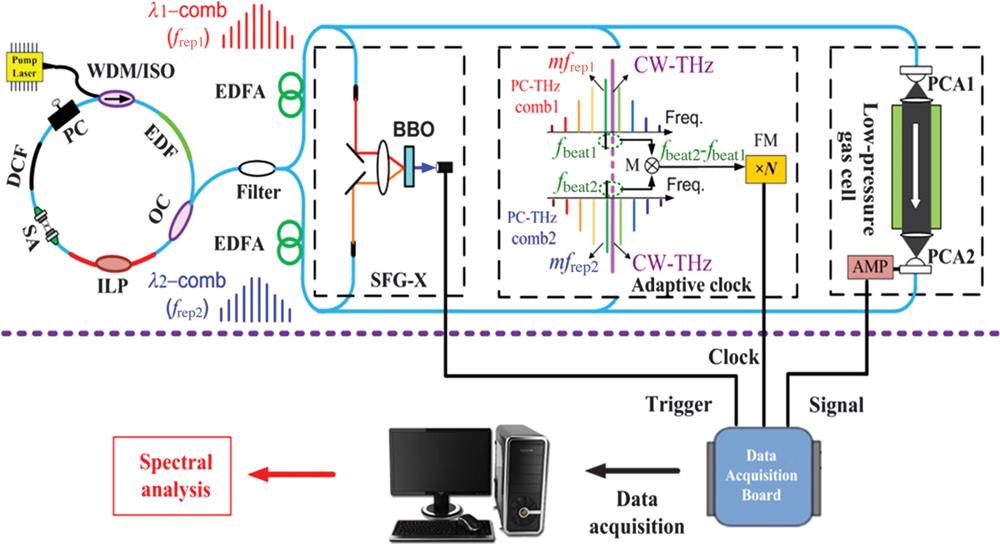
Fig. 2. Configuration of comb-mode-resolved adaptive sampling THz-DCS. SFG-X, sum-frequency-generation cross-correlator; BBO, beta-barium borate crystal; PC-THz comb, photocarrier THz comb; M, double-balanced mixer; FM, frequency multiplier (frequency multiplication factor ); PCA, photoconductive antenna; and AMP, current preamplifier.
Fig. 3. Performance of the dual-comb fiber laser. (a) Output spectrum of the laser. (b) RF spectrum of the dual-comb pulses. (c) Fluctuations of , , and . (d) Measured frequency instability of and .
Fig. 4. (a) Comparison of the temporal waveforms averaged 100,000 times obtained using different sampling clocks. Inset: a zoomed-in plot of the main THz pulse. (b) Comb-mode-resolved THz spectrum through air at room pressure. Inset: a zoomed-in plot around 0.5672 THz.
Fig. 5. Comb-mode-resolved THz spectroscopy of a mixture gas sample of and air with a total pressure of 360 Pa. Absorption spectra of within the frequency range of (a) 0.2 to 0.72 THz and (b) 0.31 to 0.37 THz. The red stars indicate the manifolds of the rotational transitions for the vibrationally excited states. (c) Comparison of the absorption spectra between the database fitting and the experimental data and their residual and (d) the corresponding zoomed-in plot around 0.3310 and 0.3677 THz. (e) Absorption spectra around 0.3310 THz and (f) 0.3677 THz.
Fig. 6. Mode-resolved absorption characterization of around 0.331 THz at (a) 430 Pa, (b) 330 Pa, (c) 280 Pa, (d) 256 Pa, (e) 149 Pa, and (f) 115 Pa.
Fig. 7. Pressure broadening characteristic of gas.
Total pressure of mixed gas (Pa) | Partial pressure of gas (Pa) | FWHM linewidth of rotation transition (MHz) | Result | Uncertainty | Result | Uncertainty | 430 | 142 | 1 | 102 | 2 | 360 | 127 | 1 | 77 | 2 | 330 | 87 | 1 | 65 | 2 | 280 | 73 | 1 | 53 | 2 | 256 | 68 | 1 | 47 | 1 | 149 | 52 | 1 | 37 | 1 | 115 | 42 | 1 | 25 | 1 |
|
Table 1. Quantitative analysis of -mixed gas.