
Shiyin CHEN, Zhiyu MA. Temporal and Spatial Characteristics and Optimization of the Intensive Use of Cultivated Land in Maoming City[J]. Journal of Resources and Ecology, 2020, 11(6): 598
- Journal of Resources and Ecology
- Vol. 11, Issue 6, 598 (2020)
Abstract
1 Introduction
In conjunction with the growth of China’s population, the improvement of urbanization and the rapid development of industrialization, the demand for construction land has also been expanding. This expansion has led to the occupation of a large amount of previously cultivated land and a sharp decrease in its total area, which has made China’s scarce cultivated land resources even more constrained, seriously threatening the country’s food security and restricting the continuing sustainable development of the regional society and economy. Therefore, while strictly guaranteeing the quantity of cultivated land, one effective way to ensure China’s future food security is by improving the intensive utilization level of cultivated land. Research on the intensive use of cultivated land originated from the land suitability classification method put forward by the United Nations Food and Agriculture Organization at the 1972 Land Evaluation Conference. Subsequently, scholars at home and abroad have conducted many studies on this issue. These studies have mainly focused on the level and temporal and spatial characteristics of the intensive use of cultivated land (
China has a vast territory and uneven economic development. Therefore, there are regional differences in the levels of intensive use of cultivated land, which are caused by differences in the driving factors. Maoming City is a traditional agricultural city in Guangdong Province, which is a major grain producing area and commodity grain base for the country. In this paper, Maoming City is taken as the research object. Through the construction of an evaluation index system, the intensive use of cultivated land in Maoming City is evaluated in time and space, and its characteristics are analyzed, in order to optimize the intensive use of cultivated land and to provide a scientific basis for promoting sustainable development of the social economy and ensuring food security in Maoming City.
2 Survey and data sources of the research area
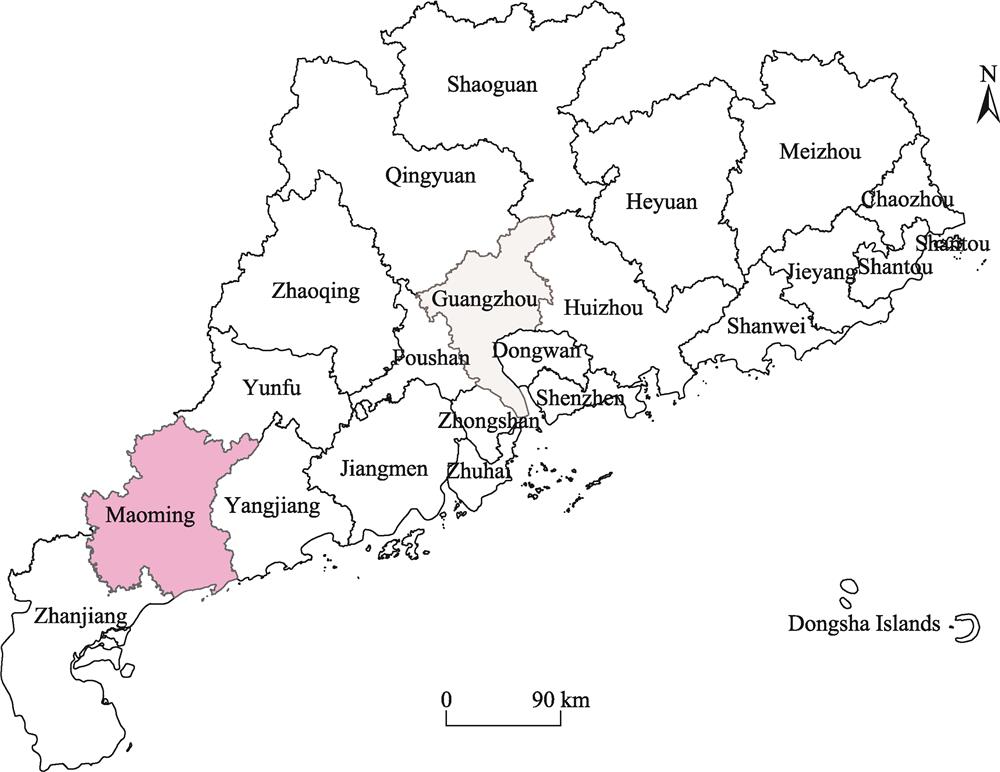
Maoming City is located in the southwest of Guangdong Province at 110°19'-111°41'E and 21°22'-22°42'N, and it is crossed by the Jianjiang River. It borders Yangjiang to the east, Zhanjiang to the west, Yunfu and the Guangxi Zhuang autonomous region to the north and the south China sea to the south (
| Major types | |||||
|---|---|---|---|---|---|
| Paddy field | Irrigated land | Dryland | |||
| Maoming | 200214 | 100 | 134955 | 34848 | 30411 |
| Huazhou | 50620 | 25.3 | 34225 | 6431 | 9946 |
| Dianbai | 52665 | 26.3 | 33068 | 8234 | 10823 |
| Gaozhou | 47582 | 23.7 | 34877 | 5634 | 7071 |
| Xinyi | 32416 | 16.2 | 21665 | 6134 | 7071 |
| Maonan | 16931 | 8.5 | 11120 | 3420 | 2391 |
Table 1.
Cultivated land spatial distribution of Maoming City in 2017(unit: ha)
![]()
Figure 1.
3 Methods
3.1 Evaluation index system
The core component of the evaluation system for the intensive use of cultivated land is an evaluation index system, which is the main basis for reflecting the degree of intensive use of cultivated land. The construction of a reasonable evaluation index system is related to the scientific validity and accuracy of the final evaluation results. To ensure the scientific nature and accuracy of this system, relevant experiences and methods, both domestically and abroad, are analyzed and used as references. Based on the characteristics of cultivated land use in Maoming City and the criteria for determining the indicators, the target layer is determined by the intensive use of cultivated land (A), with the cultivated land use intensity (B1), cultivated land use degree (B2), cultivated land output benefit (B3) and cultivated land sustainable use status (B4) as the criteria layer (
| Target layer | Criterion layer | Index layer | Weight |
|---|---|---|---|
| Intensive use of | Cultivated land use intensity (B1) | Fertilizer input per unit area (C11) | 0.7112 |
| Labor input per unit area (C12) | 0.0790 | ||
| Mechanical input per unit area (C13) | 0.2098 | ||
| Cultivated land use degree (B2) | Cropland multiple cropping index (C21) | 0.1661 | |
| Farmland irrigation index (C22) | 0.2565 | ||
| Input of farmland plastic film (C23) | 0.1247 | ||
| Cultivated land use output benefit (B3) | Per unit area yield (C31) | 0.4527 | |
| Yield safety factor (C32) | 0.1423 | ||
| Average output value per worker (C33) | 0.5737 | ||
| Sustainable use of cultivated land (B4) | Forest coverage (C41) | 0.2840 | |
| Per capita arable land (C42) | 0.3457 | ||
| Non-agricultural index (C43) | 0.6543 |
Table 2.
Cultivated land intensive use index evaluation system
3.2 Analytic Hierarchy Process (AHP) determination of weights
The determination of index weights plays an important role in developing the index evaluation system, and provides a comprehensive measure of subjective evaluation and objective reflection that determines the relative importance of the index. In this study, Analytic Hierarchy Process (AHP) is used to determine the index weights, and it is also a good method for determining the weights of both subjective and objective aspects. AHP decomposes the decision-making problem into different hierarchical structures according to the order of the overall goal, sub-goals at each level, evaluation criteria and specific schemes. It then obtains the priority weight of each element at each level to an element of the previous level by solving the eigenvector of a judgment matrix, and it finally merges the final weights of each alternative scheme with the overall goal hierarchically, by the method of a weighted sum. AHP is more suitable for decision-making problems with hierarchical and staggered evaluation indexes, and cases where the target value is difficult to describe quantitatively. It is used to construct a judgment matrix and find its maximum eigenvalue, and its corresponding feature vector
According to the importance of the evaluation index, a judgment matrix is established, and three steps are used for checking the consistency of the judgment matrix.
(1) Calculate the consistency index
where
(2) Find the corresponding average random consistency index
| Order | 1 | 2 | 3 | 4 | 5 | 6 | 7 | 8 | 9 |
|---|---|---|---|---|---|---|---|---|---|
| 0 | 0 | 0.58 | 0.9 | 1.12 | 1.24 | 1.32 | 1.41 | 1.45 |
Table 3.
The average random consistency index RI
This involves using the random method to construct 500 sample matrices, randomly extracting numbers from 1-9 and their reciprocals to construct positive and negative matrices, finding the average value of the largest characteristic root${{{\lambda }'}_{\max }}$, and defining:
(3) Calculate the consistency ratio
When
3.3 Standardization of indicators
In order to facilitate data processing, the range standardization method is adopted to standardize the original data. The range standardization formula for the evaluation factors is:
Where,
3.4 Evaluation model
The formula for the evaluation model of the intensive use degree of cultivated land is as follows:
where,
4 Results and analysis
4.1 Analysis of changes over time
By combining the analytic hierarchy process and the expert Delphi method, the weights of the evaluation indexes are calculated, and the level and changes over time of the intensive use of cultivated land in Maoming City from 2004 to 2017 are calculated.
The data in
| Year | Intensity | Degree | Output effect | Sustainable status | Intensive use of cultivated land |
|---|---|---|---|---|---|
| 2004 | 0.0614 | 0.1083 | 0.0214 | 0.2134 | 0.4045 |
| 2005 | 0.0991 | 0.2324 | 0.0234 | 0.3213 | 0.6762 |
| 2006 | 0.0221 | 0.2278 | 0.0354 | 0.3234 | 0.6087 |
| 2007 | 0.0321 | 0.0645 | 0.0137 | 0.1091 | 0.2194 |
| 2008 | 0.0423 | 0.0984 | 0.0534 | 0.2314 | 0.4255 |
| 2009 | 0.0712 | 0.1126 | 0.0837 | 0.2867 | 0.5542 |
| 2010 | 0.1118 | 0.1143 | 0.1143 | 0.3642 | 0.7046 |
| 2011 | 0.1377 | 0.1513 | 0.1421 | 0.4859 | 0.917 |
| 2012 | 0.1712 | 0.2542 | 0.1631 | 0.6643 | 1.2528 |
| 2013 | 0.1258 | 0.0872 | 0.1743 | 0.4231 | 0.8104 |
| 2014 | 0.1787 | 0.1452 | 0.2227 | 0.5121 | 1.0587 |
| 2015 | 0.2018 | 0.1423 | 0.2356 | 0.5345 | 1.1142 |
| 2016 | 0.256 | 0.1146 | 0.2539 | 0.6231 | 1.2476 |
| 2017 | 0.2622 | 0.1431 | 0.2741 | 0.6354 | 1.3148 |
Table 4.
Index of cultivated land intensive use of Maoming in 2004-2017
4.2 Spatial difference characteristics
From 2004 to 2017, a temporal difference analysis on the intensive utilization degree of cultivated land in Maoming City was conducted, but it could not explain the spatial differences of the intensive use degrees of the cultivated land. Therefore, a spatial difference analysis was carried out using the data for five county-level cities or districts in Maoming City for 2007, 2010, 2013 and 2017. The annual index evaluation of these representative areas was conducted, and the spatial differences in the intensive use of cultivated land in Maoming City were analyzed according to the evaluation results (
| City/District | 2007 | 2010 | 2013 | 2017 |
|---|---|---|---|---|
| Huazhou | 0.9245 | 1.0340 | 1.1669 | 1.3452 |
| Gaozhou | 0.9236 | 0.9727 | 1.2505 | 1.3698 |
| Xinyi | 0.8992 | 1.0668 | 1.1837 | 1.3326 |
| Dianbai | 0.8848 | 1.0805 | 1.1865 | 1.3029 |
| Maonan | 0.9593 | 1.1330 | 1.1987 | 1.3928 |
Table 5.
Cultivated land intensive use degree of cities/districts in Maoming in 2007, 2010, 2013, and 2017
![]()
Figure 2.
5 Discussion and recommendations
In view of the problems which exist in the intensive use of cultivated land in Maoming City, this study puts forward several suggestions regarding the current situation.
(1) Improve the efficiency of farmland utilization and protect basic farmland
The key to improving the utilization efficiency of cultivated land lies in paying attention to the quantity and quality of cultivated land. With the rapid development of urbanization and industrialization in Maoming City in recent years, the quantity of cultivated land in rural and urban areas has been greatly reduced. Therefore, there must be a guarantee for the quantity of cultivated land. It is necessary to ensure that the occupation of cultivated land is “one for one” and the quality is “one for the better”, and also to intensify the crackdown on the indiscriminate occupation of cultivated land. At the same time, it is also necessary to strengthen the construction of farmland water conservancy facilities and the ecological environment, to promote the scale of farmland utilization, to continuously promote agricultural mechanization, and to strive to tap into the potential of each piece of farmland and improve the efficiency of farmland utilization.
Improving the intensive use of cultivated land cannot be separated from the government’s strong support for agriculture. Maoming City should provide certain financial subsidies and receive more encouragement from the government for agricultural greenhouses. In addition, the government can set up special funds to protect arable land and basic farmland, and it can increase financial subsidies to improve farmers' ability to resist the natural risks faced by agriculture.
(2) Improve the overall urban planning and rationally adjust the layout of construction land
At present, the pace of industrialization and urbanization in Maoming City is accelerating, and the land planning and land use have also undergone tremendous changes. Against this background, in order to improve the intensive use of cultivated land, it is necessary to advance several goals: perfect the overall planning and layout of urban land, conform to the new planning background, develop overall plans, coordinate the development of the relationship between cultivated land and urbanization, scientifically predict and optimize the structure of land use, rationally distribute and adjust measures to local conditions, rationally balance the proportion of new cultivated land and new construction land; and with regard to economic development, try to occupy little or no cultivated land, and reasonably formulate the overall plan for land use.
In urban and rural areas, we should step-up efforts to crack down on the illegal occupation of cultivated land, including the implementation of a zero-tolerance policy for illegal occupation of cultivated land, and investigation of all cases one-by-one. The government should strictly implement the use of the balanced funds for occupation and compensation, and lay a solid economic foundation for the intensive use of the occupation and compensation of farmland.
(3) Raise awareness of the intensive use of cultivated land
In the process of field investigations in Maoming, a large part of the population now has a low awareness of the intensive use of cultivated land, and many farmers still rely on traditional experience to guide production, leading to a generally low level of intensive use for production. This shortcoming is related to the government’s insufficient publicity efforts. Therefore, the government must increase publicity and education so that farmers can truly realize the importance of practicing the intensive use of their cultivated land.
The government should strengthen the propaganda on the cultivated land resource shortage crisis and increase the public’s sense of social responsibility. This would allow the farmers to truly realize the prominent contradictions of cultivated land resources, leading to a better understanding by villagers of the land consolidation and investigation in rural and urban areas. Publicizing the benefits of the intensive use of cultivated land to farmers, emphasizing the cost savings and benefit improvements brought about by intensive use of cultivated land, would make the concept of intensive use of cultivated land deeply rooted in the hearts of the people.
(4) Increase agricultural investment and improve agricultural infrastructure
Judging from the intensity of cultivated land use in Maoming City, the City should increase its investments in agriculture, chemical fertilizers, pesticides and capital to improve the level of cultivated land mechanization. The field investigation found that many places in Maoming had not implemented the government’s policy to properly benefit the farmers. At the same time, the investigation found that some water conservancy facilities in Maoming had been built long ago, and the water conservancy facilities were poor, so the problem of irrigation still remained unsolved. Because of this situation, the government should increase its input of agricultural funds through various channels and in all places, especially in the mountainous and hilly areas, as a great deal of capital is required to build water conservancy facilities. At this time, the government needs to provide strong support for improving the irrigation and drainage conditions and increasing the grain production capacity of these areas.
The development of modern agriculture and furthering scientific and technological progress are the basic ways for getting out of traditional agriculture. The government should increase the training and introduction of agricultural personnel with scientific, technological and extension expertise, and give preferential policies to such trained agricultural personnel. In short, it should actively cultivate the agricultural technology market, introduce and extend science and technology, make full use of the optimal allocation of the market, and cultivate scientifically-sound practices.
6 Conclusions
Temporally, the intensive utilization level of cultivated land in Maoming City has shown an upward trend, reaching a maximum value of 1.348 in 2017, up from the minimum value of 0.2194 in 2007. The intensive utilization level in 2017 was 3.33 times that in 2004 (0.4045). However, based on the degree of cultivated land utilization in 2007, the output benefit of cultivated land and the sustainable utilization of cultivated land both declined, resulting in the minimum intensive utilization of cultivated land in 2007, with a value of 0.2194.
In terms of spatial differences, the dynamic change maps of 2007, 2010, 2013 and 2017 show that the level of intensive use of cultivated land is either high or low, and the differences are not very obvious. Maonan District basically maintains the highest level of intensive use of cultivated land, while Dianbai District and Xinyi City have restricted their development due to their own environmental conditions. In 2017, the highest level of intensive use of cultivated land was 1.3928 and the lowest was 1.3029, for a difference of 0.0899. The difference between the highest level in 2017 and the lowest level in 2007 is 0.508. Among the cities and districts analyzed, the level of intensive use of cultivated land is changing spatially, with Huazhou City developing rapidly while Xinyi City and Dianbai District are limited by local natural conditions.
References
[1] Ai FW. Study on coordinated development of intensive use of cultivated land and ecological security in Hulunbeir Region. Chinese Journal of Agricultural Resources and Regional Planning,, 39, 193-199(2018).
[2] Cao CY. Study on coupling and coordinated development of intensive use of cultivated land and new urbanization—A case study of Jiangsu Province. Chinese Journal of Agricultural Resources and Regional Planning, 39, 67-73(2018).
[3] Chen HN, Xu WH. Evaluation of intensive use of cultivated land in Shaanxi Province based on entropy method. China Population, Resources and Environment, 24, 209-212(2014).
[4] Deng CX, Xie BG, Li XQ et al. Evaluation of intensive use of cultivated land in Changsha-Zhuzhou-Xiangtan urban agglomeration based on Projection Pursuit Method. Geographical Research, 32, 2000-2008(2013).
[5] Hou XH, Wang ZQ, YangJ et al. Study on the impact of intensive use of cultivated land on actual productivity based on Kuznets Curve. Resources and Environment in the Yangtze River Basin, 26, 992-1000(2017).
[6] Liu JM, Hou XH, Wang ZQ et al. Study on spatial correlation characteristics of cultivated land fragmentation and intensive utilization level—Taking Hubei Province as an example. China Land Sciences, 31, 51-59(2017).
[7] Liu YK, Liu XL, Zhang YD et al. Study on spatial characteristics and influencing factors of intensive use of cultivated land—A case study of four cities in eastern Gansu Province. Agricultural Modernization Research, 40, 574-582(2019).
[9] Song YY, Mi WB, Zhong JT et al. Spatiotemporal pattern evolution of intensive cultivated land use in Ningxia. Economic Geography, 35, 172-181(2015).
[10] Sun YB, Su XZ, XuB. Correlation between intensive use of cultivated land and carbon emission efficiency in Hebei Province. Journal of Agricultural Engineering, 32, 258-267(2016).
[12] Wu JH, Liu SY, ShiM. Evaluation of intensive use of cultivated land in Shaanxi Province based on network analysis. Journal of Arid Land Resources and Environment, 34, 109-114(2020).
[13] Xing LP, FangB, Xiang MJ. Spatial and temporal variation characteristics and influencing factors of cultivated land intensive use level in Jiangsu Province based on GWR model. Resources and Environment in the Yangtze River Basin, 28, 376-386(2019).

Set citation alerts for the article
Please enter your email address
© Copyright 2018-2021 | Chinese Laser Press. All Rights Reserved 沪ICP备15018463号-20