• Chinese Journal of Lasers
  • Vol. 49, Issue 24, 2407204 (2022)
Chenmeng Li1, Pengfei Shao1, Bingxuan Wu1, Mingzhai Sun2, Peng Yao1, Shuwei Shen2, Peng Liu2、**, and Xiaorong Xu1、2、*
Author Affiliations
  • 1Department of Precision Machinery and Precision Instrumentation, University of Science and Technology of China, Hefei 230027, Anhui, China
  • 2Suzhou Institute for Advanced Research, University of Science and Technology of China, Suzhou 215123, Jiangsu, China
  • show less
    DOI: 10.3788/CJL202249.2407204 Cite this Article Set citation alerts
    Chenmeng Li, Pengfei Shao, Bingxuan Wu, Mingzhai Sun, Peng Yao, Shuwei Shen, Peng Liu, Xiaorong Xu. Fluorescence Emission Simulation System for Imaging Performance Testing[J]. Chinese Journal of Lasers, 2022, 49(24): 2407204 Copy Citation Text show less
    Schematic of structure and function of fluorescence emission simulation system
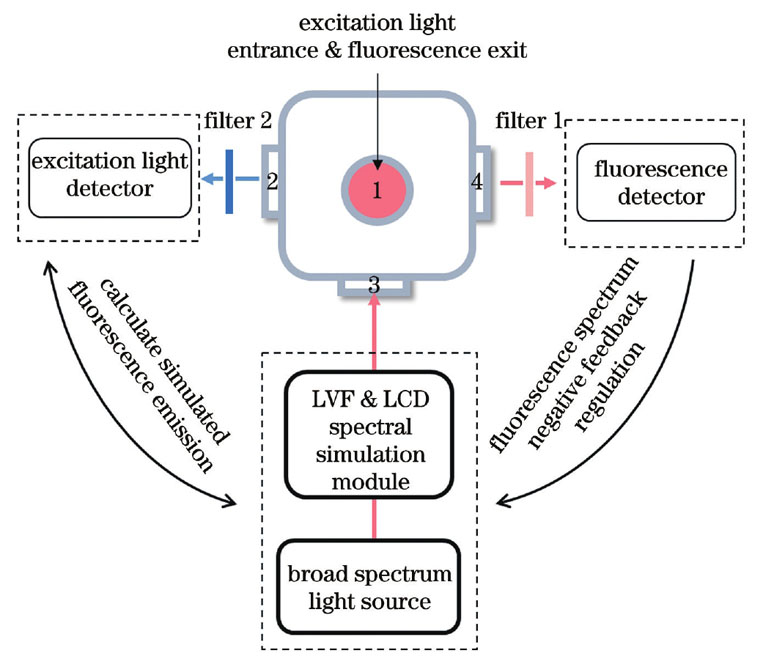
    Fig. 1. Schematic of structure and function of fluorescence emission simulation system
    Fluorescence emission simulation system. (a) Schematic of fluorescence emission simulation system; (b) schematic of spectral simulation method. The collimated broad-spectrum light source is first spatially filtered by a LVF, and then amplitude-modulated with linear polarizers and LCD to simulate target spectrum. The light source is incident into integrating sphere through port 3
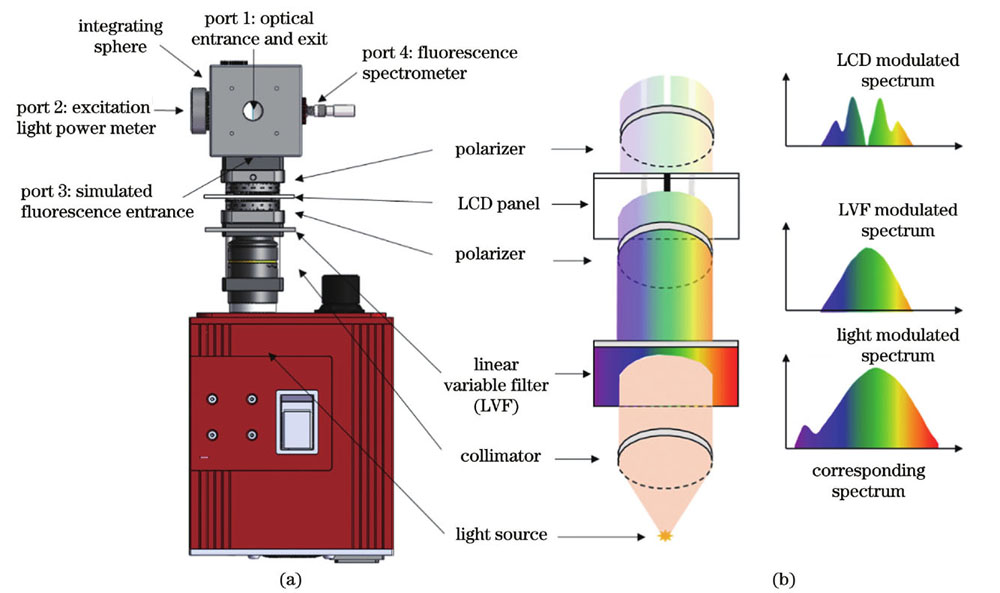
    Fig. 2. Fluorescence emission simulation system. (a) Schematic of fluorescence emission simulation system; (b) schematic of spectral simulation method. The collimated broad-spectrum light source is first spatially filtered by a LVF, and then amplitude-modulated with linear polarizers and LCD to simulate target spectrum. The light source is incident into integrating sphere through port 3
    Schematic of spectral simulation algorithm based on least squares curve fitting
    Fig. 3. Schematic of spectral simulation algorithm based on least squares curve fitting
    Flowchart of spectral simulation algorithm based on least squares curve fitting
    Fig. 4. Flowchart of spectral simulation algorithm based on least squares curve fitting
    Linear additivity of system sub-spectra. (a) Example of system pixel column transmittance spectrum sampling result; (b) verification of spectral linear additivity of the system, where“additive spectrum”is the result of adding sub-spectra of each column,“fully-open spectrum”is transmission spectrum measured when pixel columns are all turned on, and“error”is the deviation between spectra obtained by the above two methods
    Fig. 5. Linear additivity of system sub-spectra. (a) Example of system pixel column transmittance spectrum sampling result; (b) verification of spectral linear additivity of the system, where“additive spectrum”is the result of adding sub-spectra of each column,“fully-open spectrum”is transmission spectrum measured when pixel columns are all turned on, and“error”is the deviation between spectra obtained by the above two methods
    System gray-transmittance characteristics. (a) Results of sampling at different wavelengths on transmittance spectrum of pixels in columns 1150, 1200, 1250, 1300, and 1350; (b) fitting result of sub-spectral grayscale-transmittance curve of pixel columns
    Fig. 6. System gray-transmittance characteristics. (a) Results of sampling at different wavelengths on transmittance spectrum of pixels in columns 1150, 1200, 1250, 1300, and 1350; (b) fitting result of sub-spectral grayscale-transmittance curve of pixel columns
    ICG fluorescence simulation. (a) Simulation of ICG fluorescence spectrum, where“ICG spectrum”is measured spectrum of ICG aqueous solution by F7100 spectrophotometer,“fitting spectrum”is simulated fluorescence spectrum output by fluorescence emission simulation system, and“fitting error”shows deviation between the two spectra; (b) fluorescence excitation efficiency simulation of 20 nmol/L ICG fluorescence solution sample, the upper row is ROI image of fluorescence under different excitation light intensities, and the lower row is simulated fluorescence image of fluorescence emission simulation system; (c) relationship between output light intensity of fluorescence emission simulation system and gray value of fluorescence image; (d) fluorescence excitation efficiency simulation of different concentrations of fluorescent agents, left axis is the relationship between gray value of fluorescence image and excitation light intensity, and right axis is the relationship between output fluorescence intensity of fluorescence emission simulation system and excitation light intensity
    Fig. 7. ICG fluorescence simulation. (a) Simulation of ICG fluorescence spectrum, where“ICG spectrum”is measured spectrum of ICG aqueous solution by F7100 spectrophotometer,“fitting spectrum”is simulated fluorescence spectrum output by fluorescence emission simulation system, and“fitting error”shows deviation between the two spectra; (b) fluorescence excitation efficiency simulation of 20 nmol/L ICG fluorescence solution sample, the upper row is ROI image of fluorescence under different excitation light intensities, and the lower row is simulated fluorescence image of fluorescence emission simulation system; (c) relationship between output light intensity of fluorescence emission simulation system and gray value of fluorescence image; (d) fluorescence excitation efficiency simulation of different concentrations of fluorescent agents, left axis is the relationship between gray value of fluorescence image and excitation light intensity, and right axis is the relationship between output fluorescence intensity of fluorescence emission simulation system and excitation light intensity
    Fluorescence imaging sensitivity test results and comparison of different imaging systems. (a) Fluorescence imaging results of ICG solution samples with different concentrations by imaging systems; (b) fluorescence imaging results of fluorescence emission simulation system simulated ICG solution samples with different concentrations by imaging systems; (c) logarithmic relationship between fluorescence image grayscale and sample concentration for different imaging systems; (d) analysis of logarithmic output results
    Fig. 8. Fluorescence imaging sensitivity test results and comparison of different imaging systems. (a) Fluorescence imaging results of ICG solution samples with different concentrations by imaging systems; (b) fluorescence imaging results of fluorescence emission simulation system simulated ICG solution samples with different concentrations by imaging systems; (c) logarithmic relationship between fluorescence image grayscale and sample concentration for different imaging systems; (d) analysis of logarithmic output results
    Chenmeng Li, Pengfei Shao, Bingxuan Wu, Mingzhai Sun, Peng Yao, Shuwei Shen, Peng Liu, Xiaorong Xu. Fluorescence Emission Simulation System for Imaging Performance Testing[J]. Chinese Journal of Lasers, 2022, 49(24): 2407204
    Download Citation