
François Lureau, Guillaume Matras, Olivier Chalus, Christophe Derycke, Thomas Morbieu, Christophe Radier, Olivier Casagrande, Sébastien Laux, Sandrine Ricaud, Gilles Rey, Alain Pellegrina, Caroline Richard, Laurent Boudjemaa, Christophe Simon-Boisson, Andrei Baleanu, Romeo Banici, Andrei Gradinariu, Constantin Caldararu, Bertrand De Boisdeffre, Petru Ghenuche, Andrei Naziru, Georgios Kolliopoulos, Liviu Neagu, Razvan Dabu, Ioan Dancus, Daniel Ursescu. High-energy hybrid femtosecond laser system demonstrating 2 × 10 PW capability[J]. High Power Laser Science and Engineering, 2020, 8(4): 04000e43
- High Power Laser Science and Engineering
- Vol. 8, Issue 4, 04000e43 (2020)
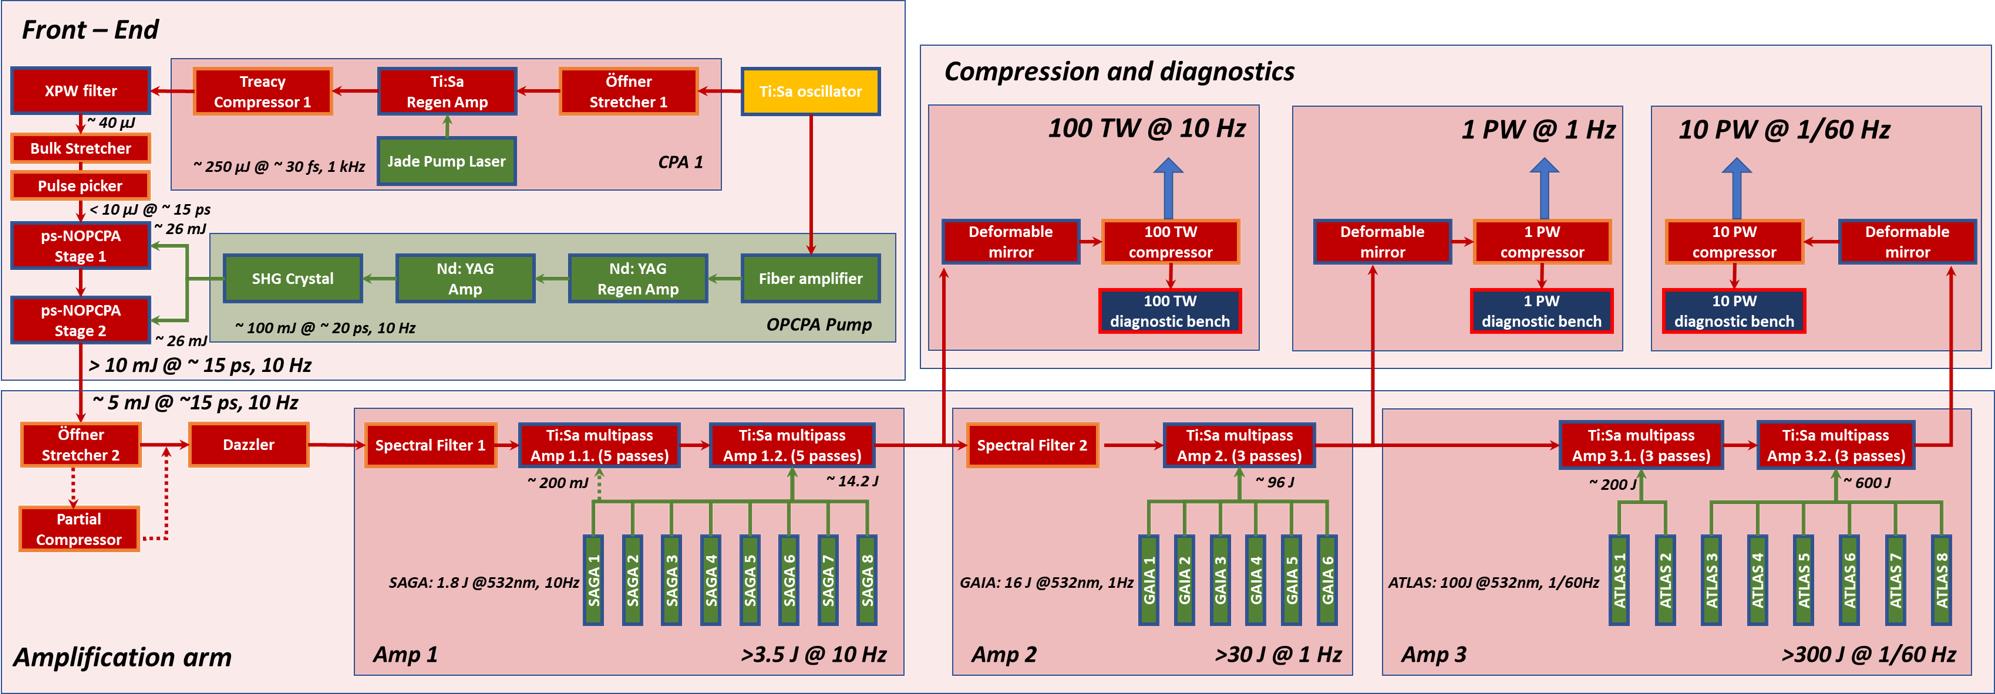
Fig. 1. Block diagram of FE and one amplification arm with the three corresponding outputs: 100 TW at 10 Hz, 1 PW at 1 Hz, and 10 PW at 1 shot/min repetition rate.
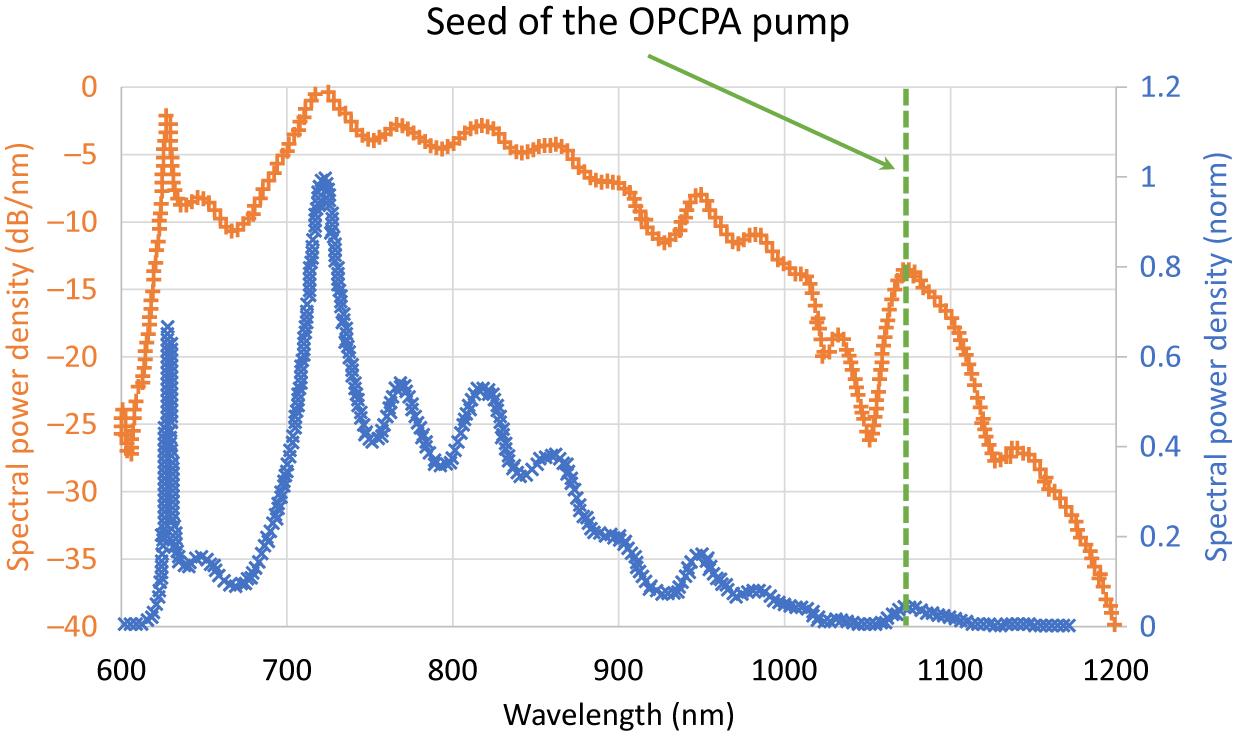
Fig. 2. Venteon oscillator spectrum.
Fig. 3. CPA1 and XPW spectra.
Fig. 4. Near-field spatial intensity profile of the picosecond pulses: (a) before beam shaping device; (b) after beam shaping device.
Fig. 5. Near-field beam intensity profile of the 532 nm picosecond pump laser for OPCPA.
Fig. 6. Evolution of the 800 nm broadband beam spatial intensity profile through the FE. The FE near-field intensity and far-field intensity profiles were measured at the output of the second OPCPA stage.
Fig. 7. Stability of the OPCPA spectrum over 7 h continuous operation. The red curve is the average of the data acquired at 10 min intervals that we represented by the gray curves.
Fig. 8. FE contrast assessment. By blocking the device input, the limitation of the measurement device sensitivity has been evaluated in the range of 10–13.
Fig. 9. The typical beam profile of the pump lasers.
Fig. 10. Pulse temporal profile of the ATLAS 100 laser, 50 ns/div; delay between laser pulses was set at 50 ns; the entire FWHM pulse duration, for combined pulses, is about 70 ns.
Fig. 11. The beam profile at the output of each main amplifier.
Fig. 12. Schematic configuration of the high-energy Ti:sapphire amplification arm.
Fig. 13. Spectral bandwidth management through the high-energy Ti:sapphire amplifiers: (a) typical reflectivity and dispersion of the spectral filters at 45° angle of incidence; (b) simulation of 100 μJ energy, Gaussian spectrum seed pulse (blue line) propagation through five chirped pulse amplifiers to reach 90 J output pulse energy, with spectral shaping mirrors (gray line) and without spectral shaping mirrors (red line).
Fig. 14. Evolution of the spectrum through the high-power Ti:sapphire amplifiers
Fig. 15. The HPLS 10 PW compressor and diagnostics diagram; the inset is a picture of one of the two ELI-NP 10 PW compressors using the meter size gratings. D.M., deformable mirror; WFS, wavefront sensor; CCD-NF, near-field CCD; CCD-FF, far-field CCD; AUTO-CO, single-shot autocorrelator; CROSS-CO, third-order cross-correlator.
Fig. 16. Extraction efficiency for the 10 PW level amplifier AMP3.2.
Fig. 17. Wizzler measurements: (a) flat spectral phase and more than 70 nm spectral bandwidth; (b) reconstructed pulse with τ = 22.7 FWHM duration.
Fig. 18. Contrast measurements at the output of the HPLS for the different amplification levels.
Fig. 19. Measured data from the wavefront sensor and far-field camera on the 10 PW diagnostic bench. The wavefront map shows a wavefront error of 0.05 μm RMS. The calculated PSF from the measured irradiance map and wavefront map shows an SR of 0.9. Far-field profile confirms the good focusability of the beam.
Fig. 20. Long-term stability test for the 1 PW level amplifier during 1 day of operation showing the energy of all the shots before compression.
|
Table 1. Main beam parameters at each amplification level during the 10 PW operation.
|
Table 2. Beam size and deformable mirror characteristics.
| ||||||||||||||||||||||||||||||||||||||||
Table 3. Measured parameters of the HPLS.
|
Table 4. Stability test for the 10 PW level amplifier running for 90 min at 300 J.

Set citation alerts for the article
Please enter your email address
© Copyright 2018-2021 | Chinese Laser Press. All Rights Reserved 沪ICP备15018463号-20