• Spectroscopy and Spectral Analysis
  • Vol. 41, Issue 11, 3480 (2021)
Si-yuan WANG1、*, Bao-jun ZHANG1、1;, Hao WANG1、1;, Si-yu GOU2、2;, Yu LI1、1;, Xin-yu LI1、1;, Ai-ling TAN1、1;, Tian-jiu JIANG2、2;, and Wei-hong BI1、1; *;
Author Affiliations
  • 11. School of Information Science and Engineering, Yanshan University, The Key Laboratory for Special Fiber and Fiber Sensor of Hebei Province, Qinhuangdao 066004, China
  • 22. Research Center for Harmful Algae and Marine Biology, Jinan University, Guangzhou 510632, China
  • show less
    DOI: 10.3964/j.issn.1000-0593(2021)11-3480-06 Cite this Article
    Si-yuan WANG, Bao-jun ZHANG, Hao WANG, Si-yu GOU, Yu LI, Xin-yu LI, Ai-ling TAN, Tian-jiu JIANG, Wei-hong BI. Concentration Monitoring of Paralytic Shellfish Poison Producing Algae Based on Three Dimensional Fluorescence Spectroscopy[J]. Spectroscopy and Spectral Analysis, 2021, 41(11): 3480 Copy Citation Text show less
    Contour maps of Gymnodinium catenatum at different concentrations(a): 103 cells·mL-1; (b): 104 cells·mL-1; (c): 105 cells·mL-1; (d): 106 cells·mL-1
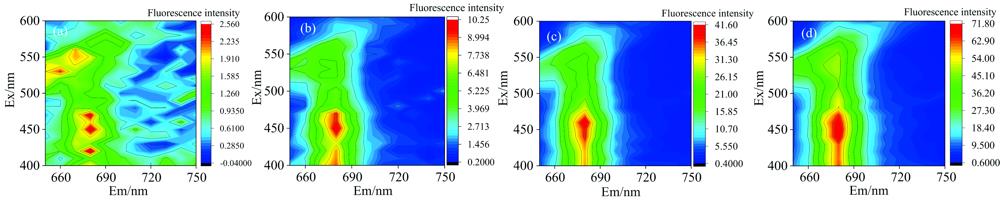
    Fig. 1. Contour maps of Gymnodinium catenatum at different concentrations
    (a): 103 cells·mL-1; (b): 104 cells·mL-1; (c): 105 cells·mL-1; (d): 106 cells·mL-1
    Contour maps of Alexandrium pacificum at different concentrations(a): 103 cells·mL-1; (b): 104 cells·mL-1; (c): 105 cells·mL-1; (d): 106 cells·mL-1
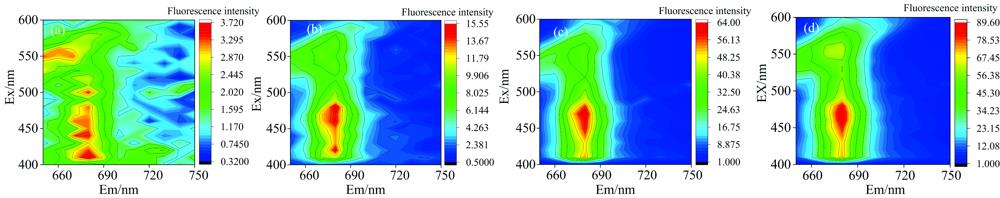
    Fig. 2. Contour maps of Alexandrium pacificum at different concentrations
    (a): 103 cells·mL-1; (b): 104 cells·mL-1; (c): 105 cells·mL-1; (d): 106 cells·mL-1
    Contour maps of Alexandrium minimum at different concentrations(a): 103 cells·mL-1; (b): 104 cells·mL-1; (c): 105 cells·mL-1
    Fig. 3. Contour maps of Alexandrium minimum at different concentrations
    (a): 103 cells·mL-1; (b): 104 cells·mL-1; (c): 105 cells·mL-1
    Relationship between predicted value and true value in training set and prediction set(a): Relationship between predicted value and true value in training set;(b): Relationship between predicted value and true value in prediction set
    Fig. 4. Relationship between predicted value and true value in training set and prediction set
    (a): Relationship between predicted value and true value in training set;(b): Relationship between predicted value and true value in prediction set
    Linear fitting results of predicted value and true value in test set
    Fig. 5. Linear fitting results of predicted value and true value in test set
    Ex/nmEm(650~700 nm)Em(650~750 nm)
    RMSECVRMSEPRcRpRMSECVRMSEPRcRp
    4001.219 81.272 20.466 10.502 70.851 10.902 90.897 10.896 4
    4101.220 11.273 90.468 80.457 30.851 40.903 90.895 30.885 8
    4200.017 30.280 80.973 00.128 50.850 50.900 30.897 30.880 8
    4300.983 01.153 80.597 90.406 60.293 40.404 70.931 40.898 4
    4400.976 01.136 00.606 00.428 70.791 70.837 20.897 70.875 5
    4500.962 91.147 20.631 40.417 20.356 10.431 30.911 10.892 5
    4600.966 71.146 60.616 70.423 70.277 20.361 80.932 80.918 6
    4701.206 81.266 80.520 80.430 20.280 80.409 70.931 60.898 2
    4801.212 71.270 30.509 80.476 00.261 70.341 80.937 20.927 8
    4900.980 61.146 20.602 30.407 50.196 60.424 20.954 10.887 4
    5000.015 30.975 80.973 00.611 40.360 30.474 80.911 10.869 1
    5100.254 40.958 60.956 70.632 70.275 80.424 20.933 10.886 1
    5200.011 51.122 70.973 00.481 40.258 80.351 60.938 00.912 9
    5300.721 11.206 30.831 20.407 00.264 00.391 20.936 50.901 8
    5400.612 01.176 30.865 30.412 90.856 70.916 30.890 20.858 5
    5500.449 11.071 70.925 40.578 50.619 91.044 50.973 00.365 0
    5600.243 70.983 10.961 70.660 10.340 20.494 40.911 70.859 2
    5701.106 51.172 60.430 30.336 50.190 40.425 00.953 60.893 9
    5801.105 61.189 40.446 50.300 20.868 80.939 90.860 10.865 3
    5900.919 81.172 20.506 10.452 70.409 00.444 60.891 40.891 7
    6000.960 11.276 80.446 20.407 30.291 70.409 00.928 20.896 9
    Table 1. Results of PSO-LSSVM quantitative model for paralytic shellfish algae under single excitation wavelength
    Ex/nmRMSEREx/nmRMSER
    4100.988 10.595 94900.964 00.618 8
    4200.966 90.615 55001.005 90.578 3
    4300.984 30.598 85301.125 70.431 0
    4400.971 10.613 65401.110 00.438 8
    4500.951 40.626 95501.111 20.437 3
    4600.972 20.609 65601.089 30.471 2
    4700.964 90.614 05301.125 70.431 0
    4800.964 90.614 0
    Table 2. Quantitative model results of PLSR algorithm under single excitation wavelength
    Ex/nmRMSECRMSEPRcRp
    460, 5300.017 10.291 00.999 90.949 2
    480, 5300.197 70.348 40.952 80.942 6
    460, 5500.134 00.322 60.964 00.937 9
    430, 4700.140 70.304 30.963 00.934 5
    460, 5600.187 30.361 90.955 00.932 3
    420, 4800.194 50.378 30.953 60.932 0
    420, 4600.182 50.355 60.956 00.931 7
    460, 4800.227 80.328 90.973 00.931 4
    420, 4700.158 00.350 70.960 30.930 4
    440, 5300.134 20.346 60.963 90.929 5
    470, 4800.199 20.318 60.952 60.928 4
    480, 5600.194 80.400 10.953 50.926 6
    430, 4800.208 10.373 70.950 60.922 7
    430, 4600.203 30.349 80.951 80.922 1
    480, 5500.177 20.365 40.956 90.920 6
    430, 5300.189 80.378 80.954 50.920 4
    Table 3. Quantitative model results of PSO-LSSVM algorithm with two excitation wavelengths
    Si-yuan WANG, Bao-jun ZHANG, Hao WANG, Si-yu GOU, Yu LI, Xin-yu LI, Ai-ling TAN, Tian-jiu JIANG, Wei-hong BI. Concentration Monitoring of Paralytic Shellfish Poison Producing Algae Based on Three Dimensional Fluorescence Spectroscopy[J]. Spectroscopy and Spectral Analysis, 2021, 41(11): 3480
    Download Citation