• Resources Science
  • Vol. 42, Issue 8, 1580 (2020)
Meirui ZHONG1、2 and Wanting SONG1、2、*
Author Affiliations
  • 1School of Business, Central South University, Changsha 410083, China
  • 2Institute of Metal Resources Strategy, Central South University, Changsha 410083, China
  • show less
    DOI: 10.18402/resci.2020.08.12 Cite this Article
    Meirui ZHONG, Wanting SONG. Impact of strategic metal price shocks on industrial output:Time-varying analysis based on the TVP-FAVAR model[J]. Resources Science, 2020, 42(8): 1580 Copy Citation Text show less
    Time-varying impulse responses of the output of strategic metal mining and dressing industry to the price shocks of strategic metal minerals
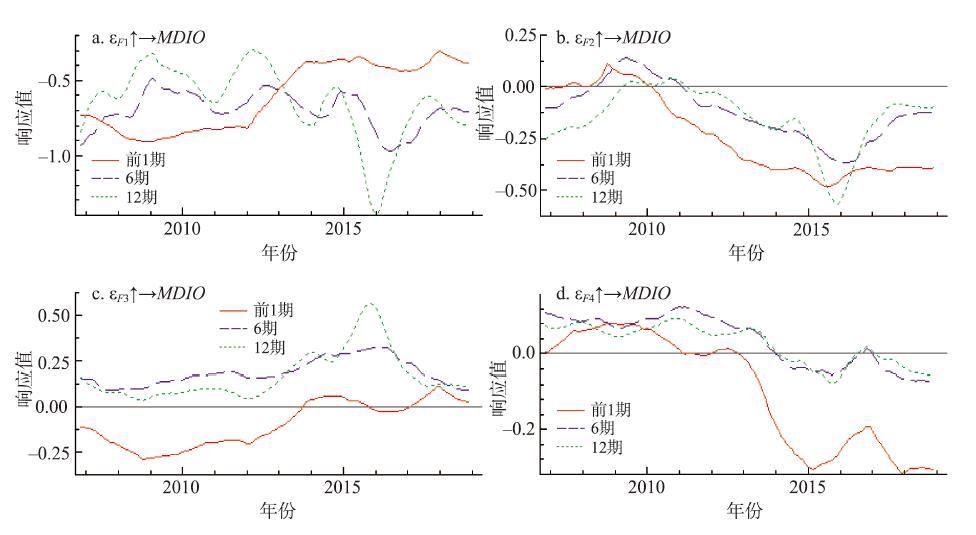
    Fig. 1. Time-varying impulse responses of the output of strategic metal mining and dressing industry to the price shocks of strategic metal minerals
    Time-varying impulse responses of output of strategic metal smelting and rolling processing industry to the price shocks of strategic metal minerals
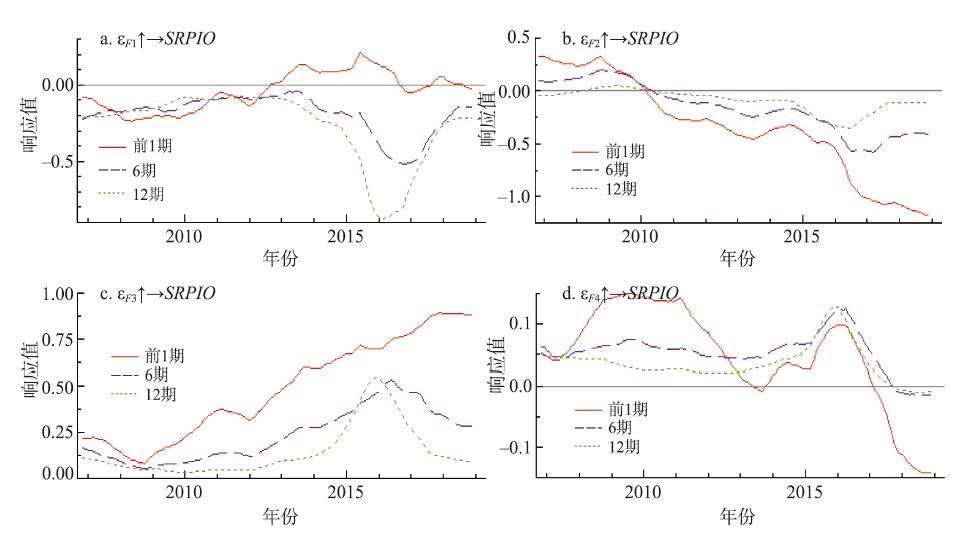
    Fig. 2. Time-varying impulse responses of output of strategic metal smelting and rolling processing industry to the price shocks of strategic metal minerals
    Impact of the price shocks of strategic metal minerals on the output of strategic metal mining and dressing industry at different time points
    Fig. 3. Impact of the price shocks of strategic metal minerals on the output of strategic metal mining and dressing industry at different time points
    Impact of strategic metal mineral price shocks on the output of strategic metal smelting and rolling processing industry at different time points
    Fig. 4. Impact of strategic metal mineral price shocks on the output of strategic metal smelting and rolling processing industry at different time points
    结构性冲击指标参考文献
    供给冲击(15个指标)矿铜产量、精炼铜产量、粗铜产量、精铝产量、矿铅产量、精炼铅产量、矿锌产量、锌锭产量、矿镍产量、精炼镍产量、矿锡产量、精炼锡产量、矿钼产量、矿金产量、矿银产量Kilian[15]、 Chen等[23]Chen等[24]、成金华等[26]
    需求冲击(20个指标)G7工业生产指数、OECD工业生产指数、欧洲工业生产指数、欧盟工业生产指数、欧元区工业生产指数、美国工业生产指数、英国工业生产指数、法国工业生产指数、德国工业生产指数、意大利工业生产指数、加拿大工业生产指数、韩国工业生产指数、印度工业生产指数、俄罗斯工业生产指数、土耳其工业生产指数、墨西哥工业生产指数、巴西工业生产指数、阿根廷工业生产指数、日本工业生产指数、中国工业增加值增速成金华等[3]、Kilian[15]Chen等[23]、Chen等[24]
    金融投机冲击(27个指标)黄金非商业多头持仓数量、黄金非商业空头持仓数量、黄金非商业套利持仓数量、黄金非商业多头持仓数量占比、黄金非商业多头持仓交易者数量、黄金非商业空头持仓数量占比、黄金非商业空头持仓交易者数量、黄金非商业套利持仓数量占比、黄金非商业套利持仓交易者数量、银非商业多头持仓数量、银非商业空头持仓数量、银非商业套利持仓数量、银非商业多头持仓数量占比、银非商业多头持仓交易者数量、银非商业空头持仓数量占比、银非商业空头持仓交易者数量、银非商业套利持仓数量占比、银非商业套利持仓交易者数量、铜非商业多头持仓数量、铜非商业空头持仓数量、铜非商业套利持仓数量、铜非商业多头持仓数量占比、铜非商业多头持仓交易者数量、铜非商业空头持仓数量占比、铜非商业空头持仓交易者数量、铜非商业套利持仓数量占比、铜非商业套利持仓交易者数量Chen等[23]、Chen等[24]程慧等[25]、成金华等[26]
    特定需求冲击(10个指标)LME铜价、COMEX铜价、LME铝价、LME锌价、LME铅价、LME镍价、LME锡价、COMEX黄金价格、COMEX银价、LME基本金属指数Chen等[23]、程慧等[25]成金华等[26]
    Table 1. Four types of structural shock indicators
    成分特征值相应特征值与后一项的差解释比例/%累积特征值累积解释比例/%
    F118.71999.513226.0018.719926.00
    F29.20683.396712.7927.926738.79
    F35.81000.86708.0733.736746.86
    F44.94311.69266.8738.679853.72
    Table 2. Principal component analysis results of four main factors
    F1R2F2R2
    全球金矿产量0.9181金属价格指数0.5785
    全球精炼铜产量0.8961OECD工业生产指数0.5480
    土耳其工业生产指数0.8910LME铜价格0.5223
    铜空头持仓数量0.7832欧洲工业生产指数0.5195
    铜多头交易者数量0.7691COMEX铜价格0.5070
    铜多头持仓数量0.7633LME铝价格0.4774
    全球精炼铅产量0.7500G7工业生产指数0.4593
    全球粗铜产量0.7429欧元区工业生产指数0.4397
    铜套利交易者数量0.7410欧盟工业生产指数0.4393
    全球锌锭产量0.7319德国工业生产指数0.3728
    F3R2F4R2
    LME锌价格0.2911黄金多头交易者数量0.6561
    金属价格指数0.2587黄金套利交易者数量0.5961
    国际银价0.2354白银多头交易者数量0.5362
    LME镍价格0.2184铜空头交易者数量0.4646
    COMEX铜价格0.2118墨西哥工业生产指数0.1909
    LME铜价格0.2102巴西工业生产指数0.1622
    欧洲工业生产指数0.2049G7工业生产指数0.1556
    欧盟工业生产指数0.2013铜套利持仓数量0.1439
    黄金多头持仓占比0.1951白银套利交易者数量0.1385
    欧元区工业生产指数0.1840美国工业生产指数0.1295
    Table 3. Top 10 main indicators and R2 values of the extracted main factors
    参数均值标准差95%下限95%上限Geweke无效因子
    (F1, F2, F3, F4, MDIO)
    (β)10.02270.00250.01840.02820.39408.9900
    (β)20.02250.00250.01830.02800.55308.4700
    (α)10.08560.02960.04480.15530.291063.0000
    (α)20.08190.02850.04310.15360.411040.3400
    (h)10.23070.09940.08260.44580.1120125.9800
    (h)20.30050.10750.13310.56310.739078.8300
    (F1, F2, F3, F4, SRPIO)
    (β)10.02240.00260.01800.02820.84309.3600
    (β)20.02230.00240.01820.02770.28506.9100
    (α)10.09240.03600.04780.18450.270049.9100
    (α)20.08080.02780.04220.15220.444068.5100
    (h)10.21440.10270.07320.49220.998093.2800
    (h)20.28480.10740.11960.52340.719089.2800
    Table 4. Model parameter estimation results
    F1F2F3F4
    战略性金属矿采选业1期后0.96490.94830.00130.0206
    6期后4.99071.61494.59060.1088
    12期后15.36281.72786.24890.1125
    战略性金属冶炼及压延加工业1期后0.00151.47390.02090.7189
    6期后0.43794.14891.81960.5419
    12期后2.25786.43722.28670.5118
    Table 5. Contribution of strategic metal price shocks to the forecast variance of strategic metal industry output (%)
    Meirui ZHONG, Wanting SONG. Impact of strategic metal price shocks on industrial output:Time-varying analysis based on the TVP-FAVAR model[J]. Resources Science, 2020, 42(8): 1580
    Download Citation