
Vahid Foroughi Nezhad, Chenglong You, Georgios Veronis. Nanoplasmonic magneto-optical isolator [Invited][J]. Chinese Optics Letters, 2021, 19(8): 083602
- Chinese Optics Letters
- Vol. 19, Issue 8, 083602 (2021)
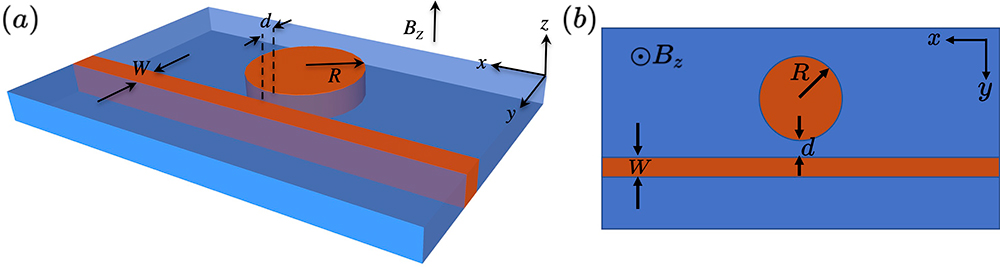
Fig. 1. (a) Nanoplasmonic isolator that consists of a cylindrical cavity with radius R placed close to an MDM waveguide with width W. The metal and MO material are shown with blue and orange colors, respectively. The structure is under a static magnetic field in the z direction. (b) Cross-sectional view of the structure at the z = 0 plane.
![(a) Resonant wavelength of the cylindrical resonator when the MDM waveguide is absent (d = ∞ in Fig. 1) as a function of the radius R of the cavity. The metal is silver, and the MO material is bismuth iron garnet (BIG). The resonant wavelength λc without MO activity (α = 0) calculated with FDFD is shown with black circles. The resonant wavelengths λ+ and λ_, when MO activity is present (α = 0.5), calculated with FDFD are shown with red and blue circles, respectively. The resonant wavelengths of the cylindrical resonator when the MDM waveguide is absent calculated by solving Eq. (2) are shown with black, red, and blue solid lines. (b) The difference Δλ = λ+−λ_ between the resonant wavelengths λ+ and λ_ of the cylindrical resonator when the MDM waveguide is absent (d = ∞ in Fig. 1) as a function of the strength of MO activity α calculated with FDFD (red dots) for R = 120 nm. Also shown are the exact results calculated by solving Eq. (2) (solid line) and the perturbation theory results [Eq. (3)] (open circles) for the cylindrical resonator when the MDM waveguide is absent.](/richHtml/col/2021/19/8/083602/img_002.jpg)
Fig. 2. (a) Resonant wavelength of the cylindrical resonator when the MDM waveguide is absent (d = ∞ in Fig. 1 ) as a function of the radius R of the cavity. The metal is silver, and the MO material is bismuth iron garnet (BIG). The resonant wavelength λc without MO activity (α = 0) calculated with FDFD is shown with black circles. The resonant wavelengths λ+ and λ_, when MO activity is present (α = 0.5), calculated with FDFD are shown with red and blue circles, respectively. The resonant wavelengths of the cylindrical resonator when the MDM waveguide is absent calculated by solving Eq. (2 ) are shown with black, red, and blue solid lines. (b) The difference Δλ = λ+−λ_ between the resonant wavelengths λ+ and λ_ of the cylindrical resonator when the MDM waveguide is absent (d = ∞ in Fig. 1 ) as a function of the strength of MO activity α calculated with FDFD (red dots) for R = 120 nm. Also shown are the exact results calculated by solving Eq. (2 ) (solid line) and the perturbation theory results [Eq. (3 )] (open circles) for the cylindrical resonator when the MDM waveguide is absent.
Fig. 3. (a) Transmission T, reflection R, and absorption A spectra without MO activity (α = 0) for the structure of Fig. 1 calculated with FDFD for R = 120 nm, W = 50 nm, and d = 10 nm. (b) Same as (a) except d = 15 nm. (c) Same as (a) except d = 30 nm. (d) Transmission T spectra for α = 0 and d = 30 nm. Also shown are the transmission spectra in the absence of loss in the metal (γ = 0).
Fig. 4. Difference Δλ = λ+−λ_ between the resonant wavelengths λ+ and λ_ of the structure shown in Fig. 1 with W = 50 nm and R = 120 nm as a function of the distance d between the cavity and the waveguide. Results are shown for different strengths of MO activity (α = 0, 0.05, 0.1, 0.15, 0.2) and for lossless metal (γ = 0).
Fig. 5. (a) Transmission spectra for the structure of Fig. 1 calculated with FDFD for R = 120 nm, d = 15 nm, and W = 50 nm, when MO activity is present (α = 0.06), and light is incident from the left (forward) and right (backward) directions. Also shown are the transmission spectra without MO activity (α = 0). (b) Reflection spectra for the structure of Fig. 1 . All other parameters are as in (a). (c) Absorption spectra for the structure of Fig. 1 . All other parameters are as in (a). (d) Magnetic field profiles at λ = λ−=1310 nm when MO activity is present (α = 0.06), and light is incident from the left (bottom figure) and right (top figure) directions. All other parameters are as in (a).
Fig. 6. (a) Resonant wavelength λ− when MO activity is present for the structure of Fig. 1 as a function of the radius R of the cylindrical cavity and the distance d between the cavity and the waveguide calculated with FDFD. All other parameters are as in Fig. 5(a) . (b) Insertion loss, defined as −10 log10(Ton), for the structure of Fig. 1 as a function of R and d calculated with FDFD. Here, Ton is the transmission for light incident from the right direction. The insertion loss is calculated at the resonant wavelength λ− when MO activity is present, which is a function of R and d. (c) Isolation ratio for the structure of Fig. 1 as a function of R and d calculated with FDFD. The isolation ratio is defined as the ratio of the transmission for light incident from the right direction Ton to the transmission for light incident from the left direction Toff. The isolation ratio is calculated at the resonant wavelength λ− when MO activity is present, which is a function of R and d.

Set citation alerts for the article
Please enter your email address
© Copyright 2018-2021 | Chinese Laser Press. All Rights Reserved 沪ICP备15018463号-20