
M. Cipriani, S. Yu. Gus’kov, F. Consoli, R. De Angelis, A. A. Rupasov, P. Andreoli, G. Cristofari, G. Di Giorgio, M. Salvadori. Time-dependent measurement of high-power laser light reflection by low-Z foam plasma[J]. High Power Laser Science and Engineering, 2021, 9(3): 03000e40
- High Power Laser Science and Engineering
- Vol. 9, Issue 3, 03000e40 (2021)
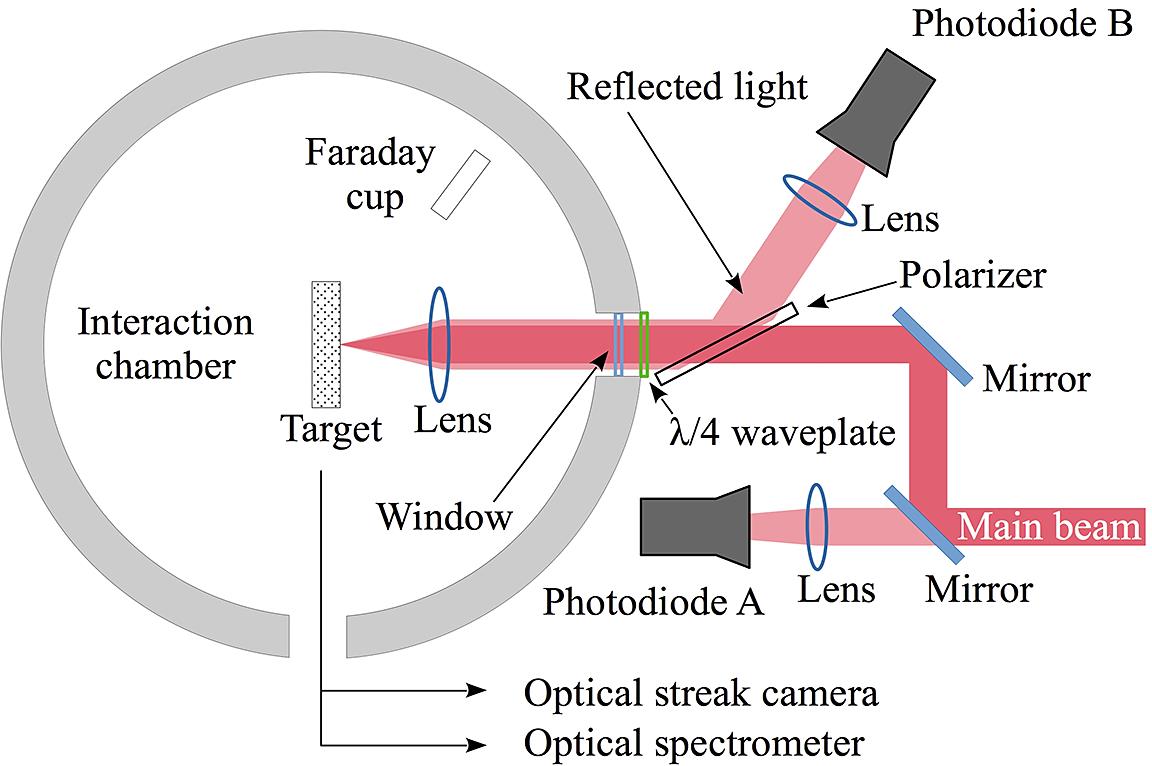
Fig. 1. The experimental setup used in the campaign. The photodiode A is used to monitor the time dependency of the incident laser energy profile, whereas the photodiode B collects the laser light reflected by the plasma. A Faraday cup provides, by a time-of-flight analysis, information on the energetic content of the plasma. An optical streak camera, placed on the equatorial plane at 90° from the target normal, is used to monitor the evolution of both the plasma created on the front surface by the laser–target interaction and the plasma produced on the rear side of the target by the blow-off of the shock wave generated in the foam. An optical spectrometer is placed along the same line of sight for a spectrally resolved monitoring of the plasma self-emission.
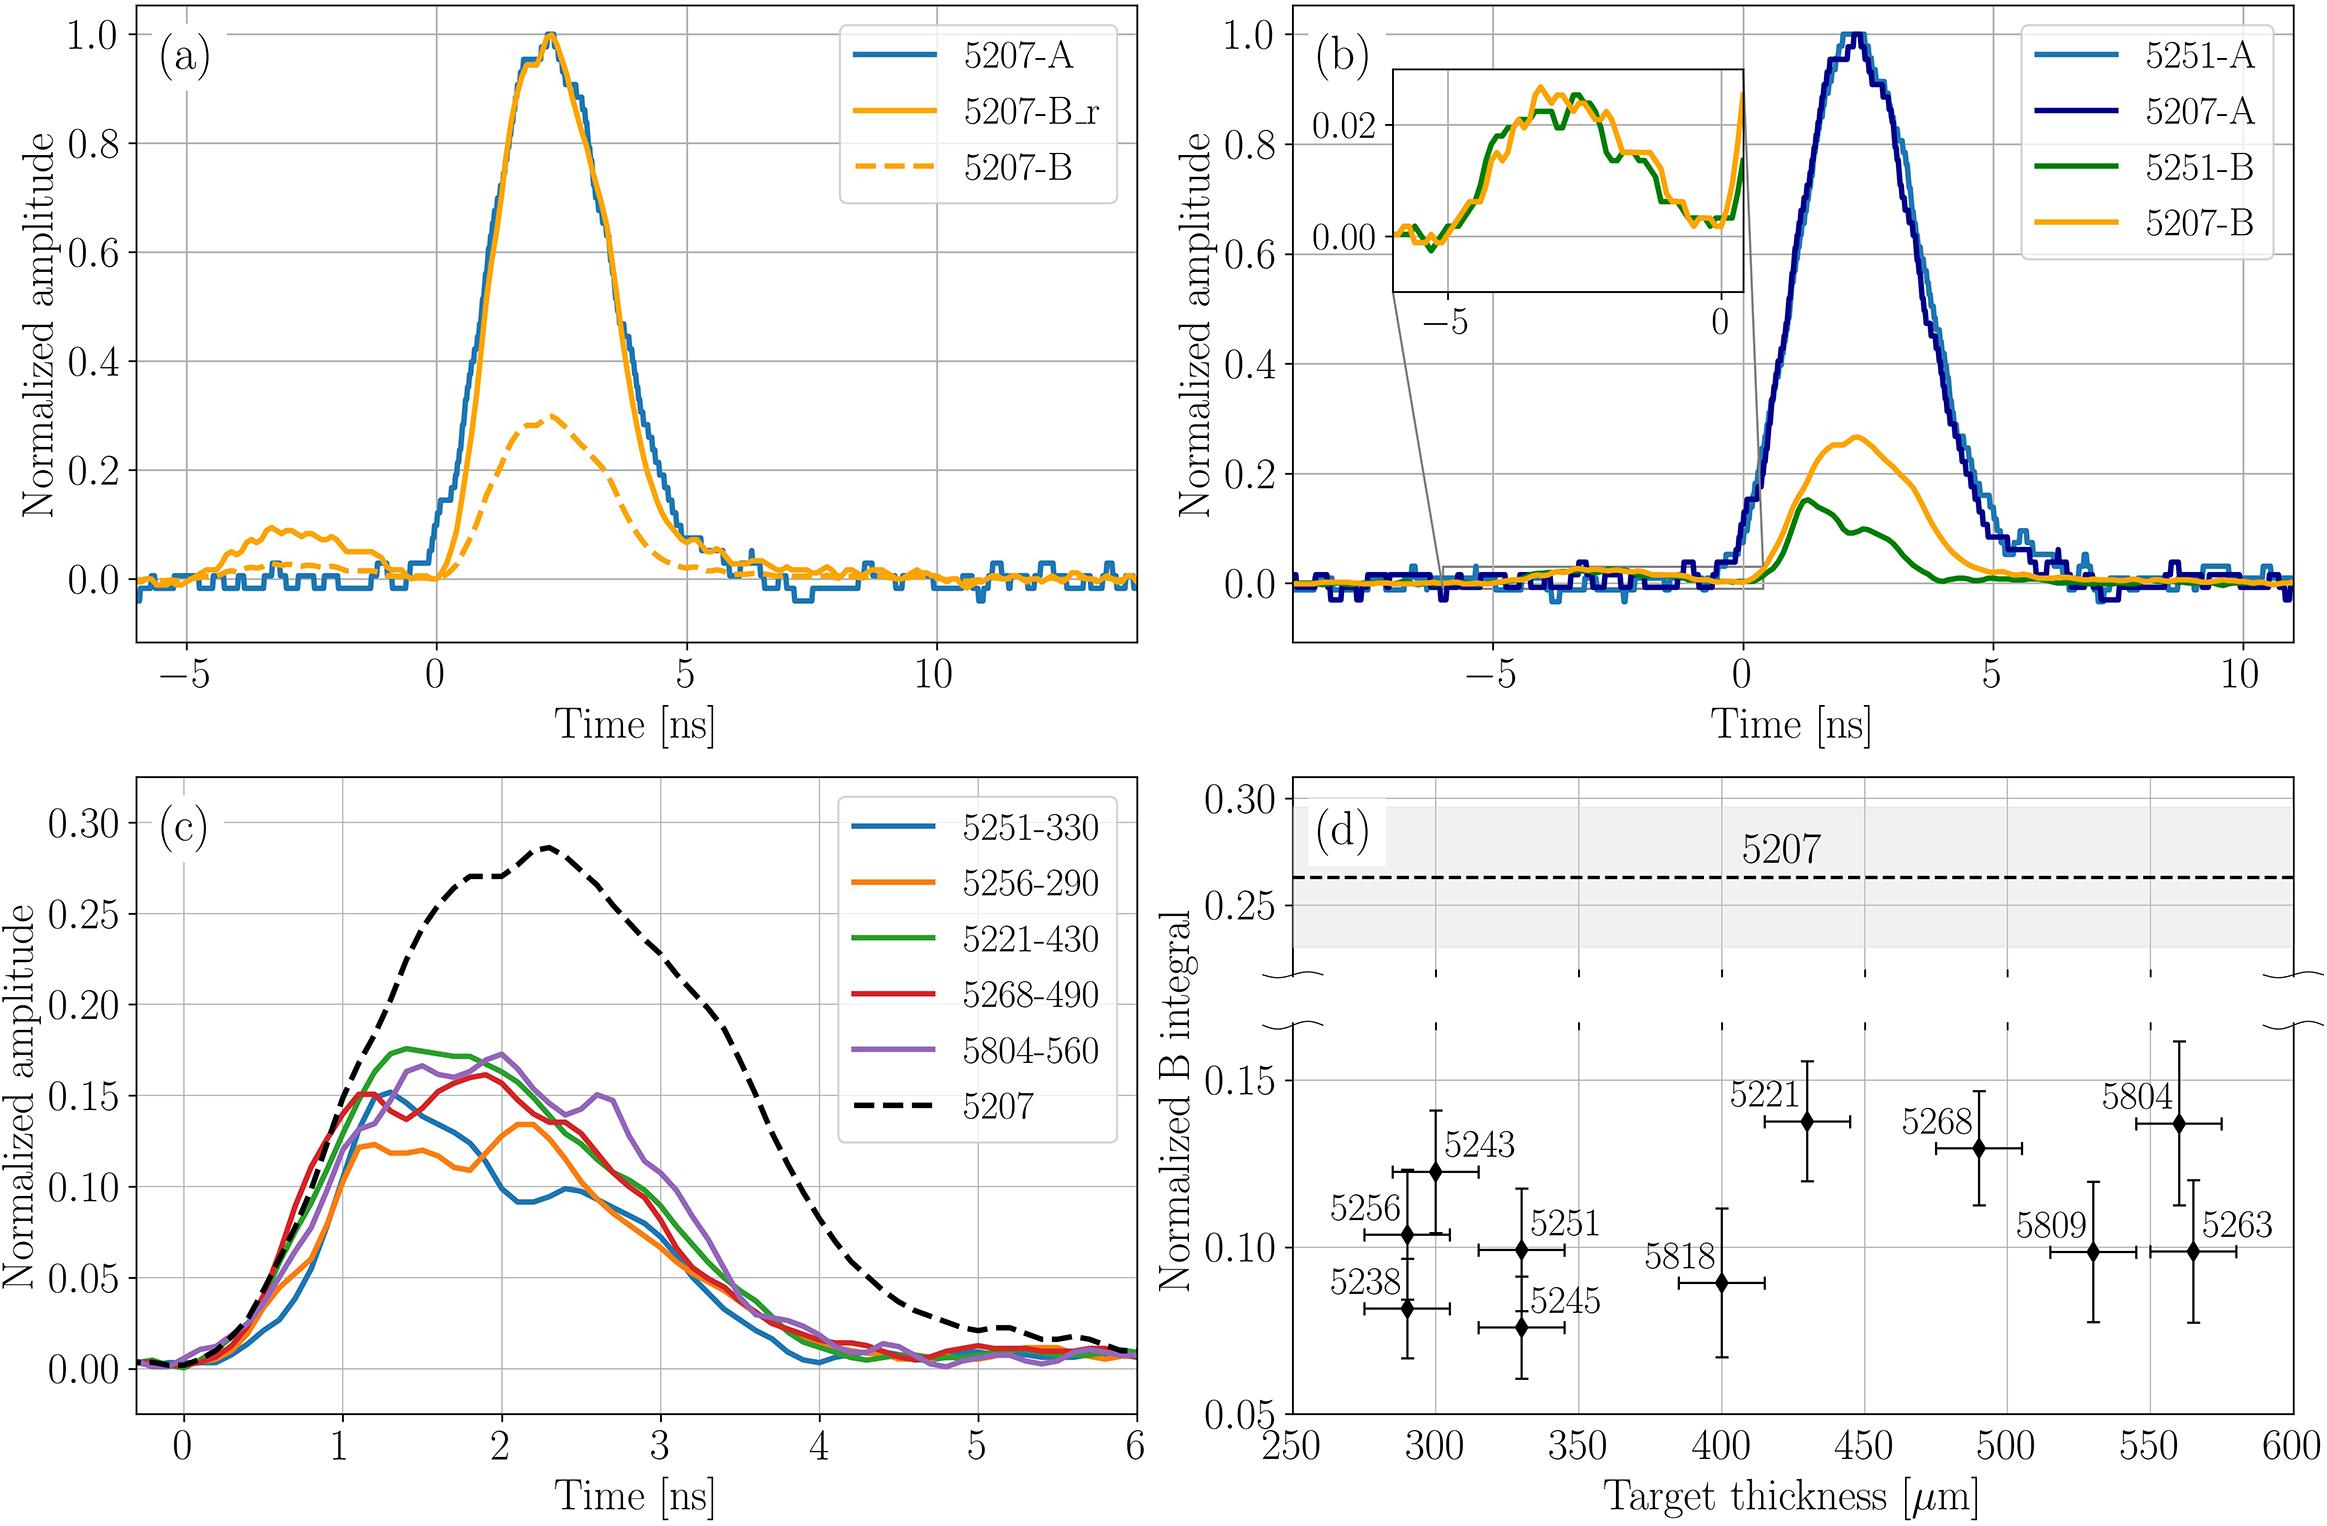
Fig. 2. Typical time-dependent and integrated results from the shots performed in the campaign for the reflected light. In the shot 5207 the target was solid polystyrene, whereas in all the others it was a polystyrene foam. The labels “A” and “B” in the legends, according to Figure 1, indicate the photodiode from which the signal was recorded. Each signal is normalized to the maximum of the corresponding A signal, with the exception of B_r. The origin of the time axes corresponds to the time at which the main pulse hits the target. (a) The results of the shot with solid polystyrene. The signal named B_r is the B signal normalized to one. (b) The comparison between the shot in (a) and one of the shots with foam polystyrene (shot 5251). The inset in (b) shows an enlarged view of the reflection from the chamber window. (c) Typical reflected light signals recorded in the campaign. The foam thickness is indicated in the legend, next to the shot number. (d) The values of the integral of the B signals for all the shots of the campaign, plotted versus the target thickness and normalized to the integral of the corresponding A signal. The horizontal dashed line indicates the value of the integral of the B signal for the shot on solid polystyrene, with its error indicated by the gray shading.
Fig. 3. Typical signals obtained from the plasma diagnostics in the performed campaign: (a) typical spectra obtained with the spectrometer for the solid (shot 5207) and the foam (shot 5238) targets; (b) a typical signal obtained for the same latter shot on a foam target from a Faraday cup placed at 54° from the target normal; the oscillations for energies higher than 5 keV/a.m.u are due to EMP fields coupling to the detector. Here it is possible to see the thermal component of the plasma, with main peak at about 1 keV/a.m.u.
Fig. 4. Scheme of the mechanism of reflection and transmission of light in the target, following the algorithm described in the text. Here δ0 is the pore size parameter required by the algorithm.
Fig. 5. The comparison between the B signals for shots 5245, 5251, and 5256 on foam targets, as well as for the shot 5207 on the solid target and the simulated ones. In the simulation, the foam target was 320 μm thick, its average density was  mg/cm3, δ0 = 40 μm, and
  = 0.1. The dashed red line is the simulated B signal for a homogeneous target with the same density as the foam targets.
mg/cm3, δ0 = 40 μm, and = 0.1. The dashed red line is the simulated B signal for a homogeneous target with the same density as the foam targets. Fig. 6. The profiles of the density, temperature, pressure, and specific laser energy deposition for selected times indicated at the top of the picture. The red and the black lines correspond to simulations of foam targets with the laser light reflection turned on (“Red simulation” in the text) and off (“Black simulation” in the text), respectively. For both simulations, the blue-framed plots correspond to times before the homogenization time, whereas the green-framed plots correspond to times after the homogenization time. The target and laser parameters are the same as in Figure 5 for both simulations. The orange lines correspond to a simulation (“Orange simulation” in the text) with the same target thickness, target density, and laser intensity as Red and Black simulations but with a homogeneous target. All the plot values are referred to the coordinates of the target at the zero time of the simulation, for better representation.
Fig. 7. The reflected (dashed lines) and transmitted (solid lines) for the Black (black lines) and the Red (red lines) simulations.
|
Table 1. The absorption efficiency for some shots and target thicknesses obtained from MULTI-FM simulations until the time of complete ablation of the target.

Set citation alerts for the article
Please enter your email address
© Copyright 2018-2021 | Chinese Laser Press. All Rights Reserved 沪ICP备15018463号-20