• Chinese Optics Letters
  • Vol. 17, Issue 10, 100013 (2019)
Mohammed Sait, Xiaobin Sun, Omar Alkhazragi, Nasir Alfaraj, Meiwei Kong, Tien Khee Ng, and Boon S. Ooi*
Author Affiliations
  • Photonics Laboratory, King Abdullah University of Science and Technology (KAUST), Thuwal 23955-6900, Saudi Arabia
  • show less
    DOI: 10.3788/COL201917.100013 Cite this Article Set citation alerts
    Mohammed Sait, Xiaobin Sun, Omar Alkhazragi, Nasir Alfaraj, Meiwei Kong, Tien Khee Ng, Boon S. Ooi. The effect of turbulence on NLOS underwater wireless optical communication channels [Invited][J]. Chinese Optics Letters, 2019, 17(10): 100013 Copy Citation Text show less
    Experimental setup for (a) turbulence due to air bubbles and (b) turbulence due to temperature.
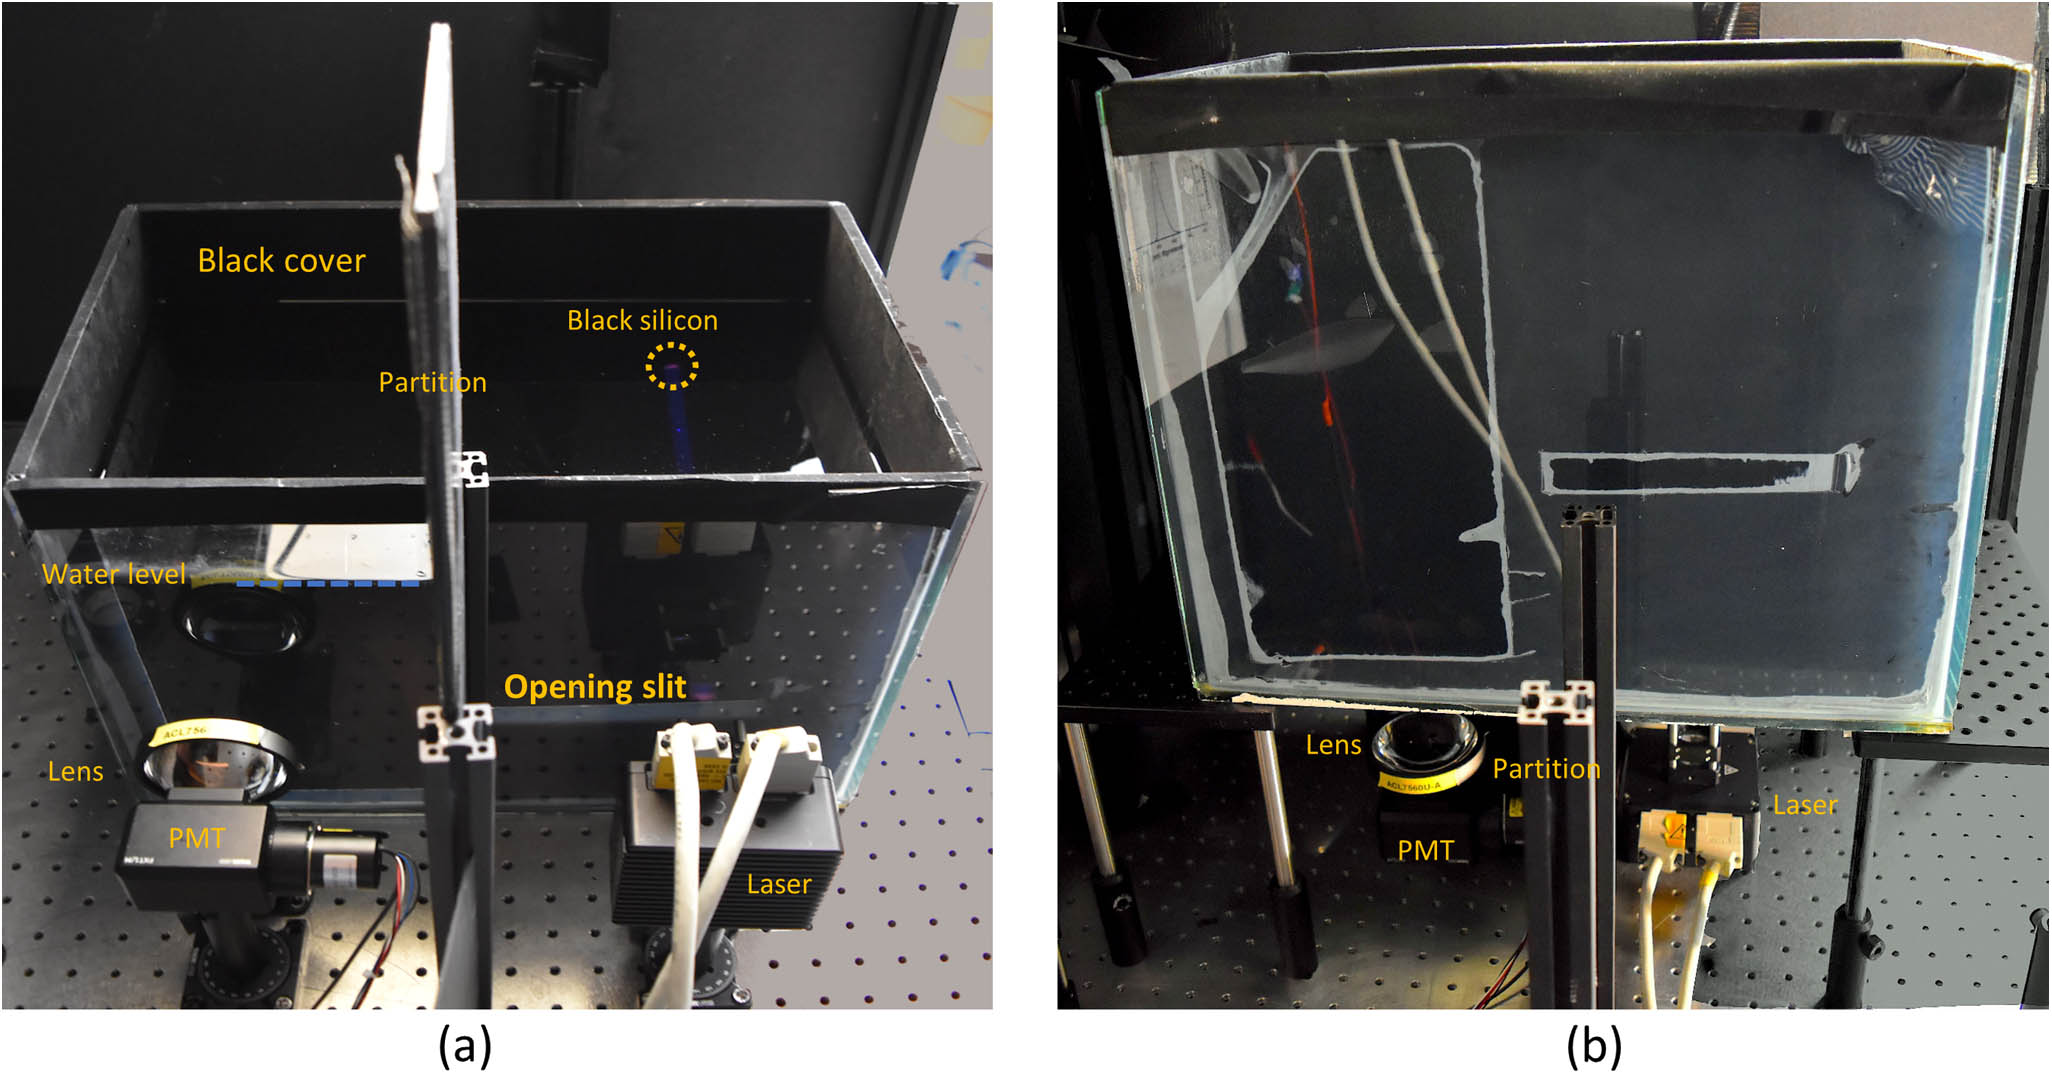
    Fig. 1. Experimental setup for (a) turbulence due to air bubbles and (b) turbulence due to temperature.
    Measured reflectivity spectra of black silicon and black cloth.
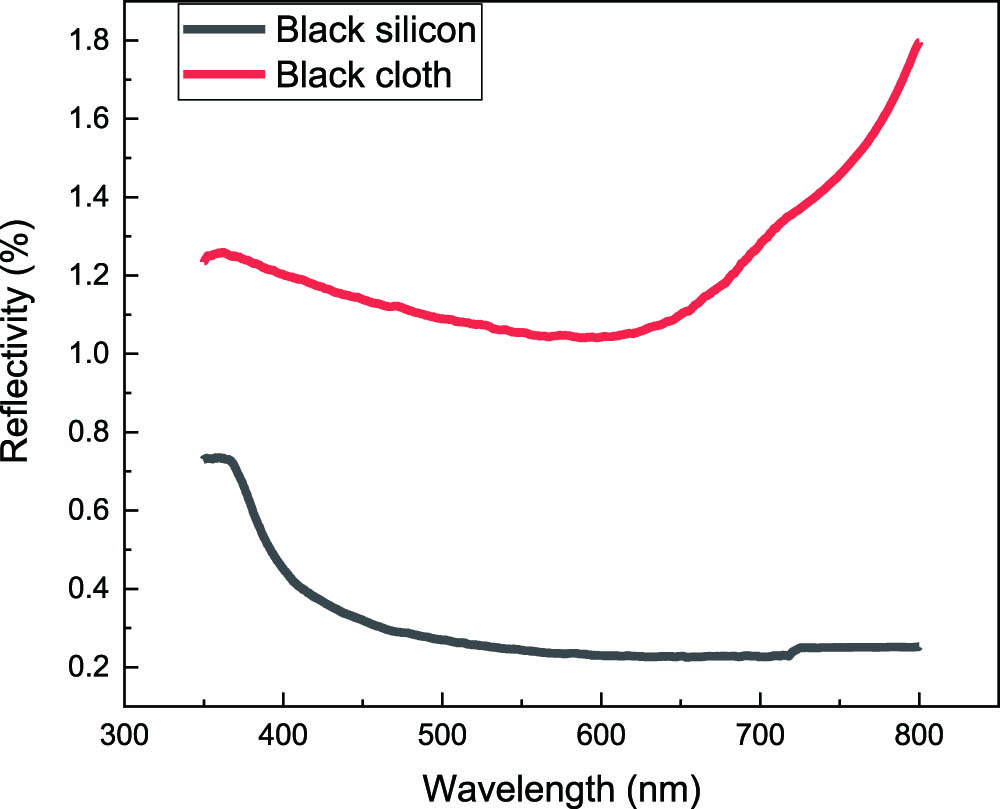
    Fig. 2. Measured reflectivity spectra of black silicon and black cloth.
    Photographs of four different air bubbles in the water channel under four different water circulation levels with corresponding bubble size histograms.
    Fig. 3.  Photographs of four different air bubbles in the water channel under four different water circulation levels with corresponding bubble size histograms.
    Optical signal through bubbly water with (a) no bubbles with σI2=1.0764×10⁻⁴; (b) small bubbles with σI2=0.1027; (c) medium bubbles with σI2=0.1569; (d) large bubbles with σI2=0.3591; and (e) x-large bubbles with σI2=0.5195.
    Fig. 4. Optical signal through bubbly water with (a) no bubbles with σI2=1.0764×10⁴; (b) small bubbles with σI2=0.1027; (c) medium bubbles with σI2=0.1569; (d) large bubbles with σI2=0.3591; and (e) x-large bubbles with σI2=0.5195.
    Histograms of the received optical signal through bubbly water with (a) no bubbles with σI2=1.0764×10⁻⁴; (b) small bubbles with σI2=0.1027; (c) medium bubbles with σI2=0.1569; (d) large bubbles with σI2=0.3591; and (e) x-large bubbles with σI2=0.5195. (f) A plot of the scintillation index and normalized received power against the mean bubble area.
    Fig. 5. Histograms of the received optical signal through bubbly water with (a) no bubbles with σI2=1.0764×10⁴; (b) small bubbles with σI2=0.1027; (c) medium bubbles with σI2=0.1569; (d) large bubbles with σI2=0.3591; and (e) x-large bubbles with σI2=0.5195. (f) A plot of the scintillation index and normalized received power against the mean bubble area.
    (a) Received optical signal through the temperature difference corresponding to 0°C, 6°C, and 10°C; (b) a plot of the scintillation index and normalized received power against the mean bubble area.
    Fig. 6. (a) Received optical signal through the temperature difference corresponding to 0°C, 6°C, and 10°C; (b) a plot of the scintillation index and normalized received power against the mean bubble area.
    Inlet 1 Temperature (°C)Inlet 2 Temperature (°C)Temperature Gradient (°C·cm−1)Mean Temperature (°C)
    2030∼0.425
    2228∼0.2
    25250.0
    Table 1. Different Temperature Values Used to Create the Temperature Gradient
    Mohammed Sait, Xiaobin Sun, Omar Alkhazragi, Nasir Alfaraj, Meiwei Kong, Tien Khee Ng, Boon S. Ooi. The effect of turbulence on NLOS underwater wireless optical communication channels [Invited][J]. Chinese Optics Letters, 2019, 17(10): 100013
    Download Citation