
Xueru ZHANG, Jie ZHOU, Guoning LI, Chun CHEN, Mengmei LI, Jianmei LUO. Spatial pattern reconstruction of regional habitat quality based on the simulation of land use changes from 1975 to 2010[J]. Journal of Geographical Sciences, 2020, 30(4): 601
- Journal of Geographical Sciences
- Vol. 30, Issue 4, 601 (2020)
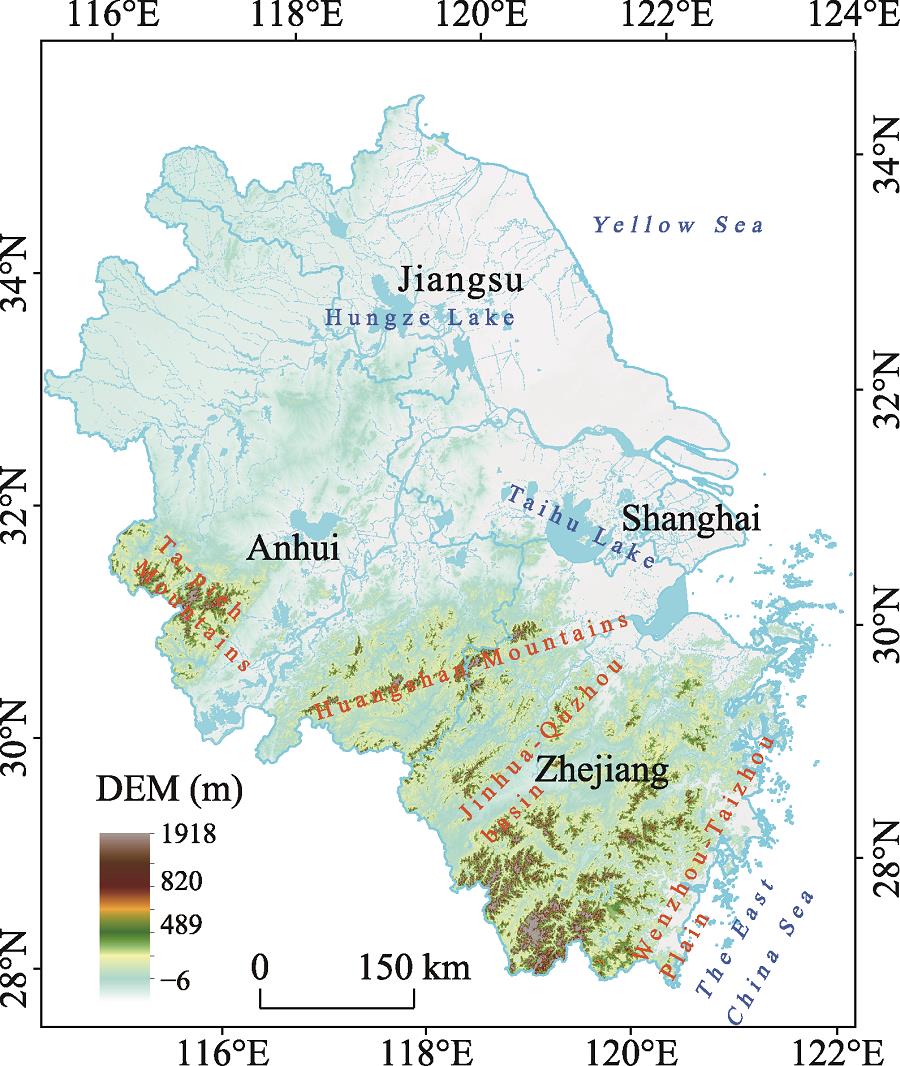
Fig. 1. Location and topography of the Pan-Yangtze River Delta region
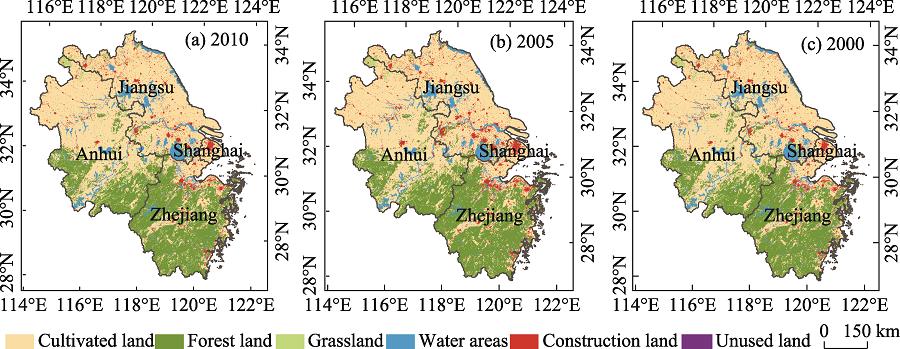
Fig. 2. Land use maps of the Pan-Yangtze River Delta region for 2010, 2005, and 2000
Fig. 3. Map of land use simulation in the Pan-Yangtze River Delta region
Fig. 4. Degrees of habitat deterioration in the Pan-Yangtze River Delta region from 1975 to 2010
Fig. 5. Map showing habitat degeneration in the Pan-Yangtze River Delta region from 1975 to 2010
Fig. 6. Map showing the habitat degradation degree classification of the Pan-Yangtze River Delta region from 1975 to 2010
Fig. 7. Map of habitat quality in the Pan- Yangtze River Delta region from 1975 to 2010
Fig. 8. Spatial distribution of habitat quality in the Pan-Yangtze River Delta region from 1975 to 2010
|
Table 1.
Threat factors and their stress intensities
| ||||||||||||||||||||||||||||||||||||||||||||||
Table 2.
Sensitivity of land use type to habitat threat factors

Set citation alerts for the article
Please enter your email address
© Copyright 2018-2021 | Chinese Laser Press. All Rights Reserved 沪ICP备15018463号-20