• Chinese Optics Letters
  • Vol. 20, Issue 9, 093001 (2022)
Linquan Lai1, Yue Chen1, Kongtao Chen1, Jiale Tang1, Kaiwen Yin1, Fuqiang Jia1、*, Dun Qiao2, Yuanlong Fan2, Kang Li2, and Nigel Copner2
Author Affiliations
  • 1Fujian Key Laboratory of Ultrafast Laser Technology and Applications, School of Electronic Science and Technology, Xiamen University, Xiamen 361005, China
  • 2Wireless & Optoelectronics Research & Innovation Centre, Faculty of Computing, Engineering & Science, University of South Wales, Wales CF37 1DL, UK
  • show less
    DOI: 10.3788/COL202220.093001 Cite this Article Set citation alerts
    Linquan Lai, Yue Chen, Kongtao Chen, Jiale Tang, Kaiwen Yin, Fuqiang Jia, Dun Qiao, Yuanlong Fan, Kang Li, Nigel Copner. Reconstruction and fitting of second-harmonic signals by wavelength modulation spectroscopy method based on fast Fourier transform[J]. Chinese Optics Letters, 2022, 20(9): 093001 Copy Citation Text show less
    Experimental setup for the validation of the proposed method.
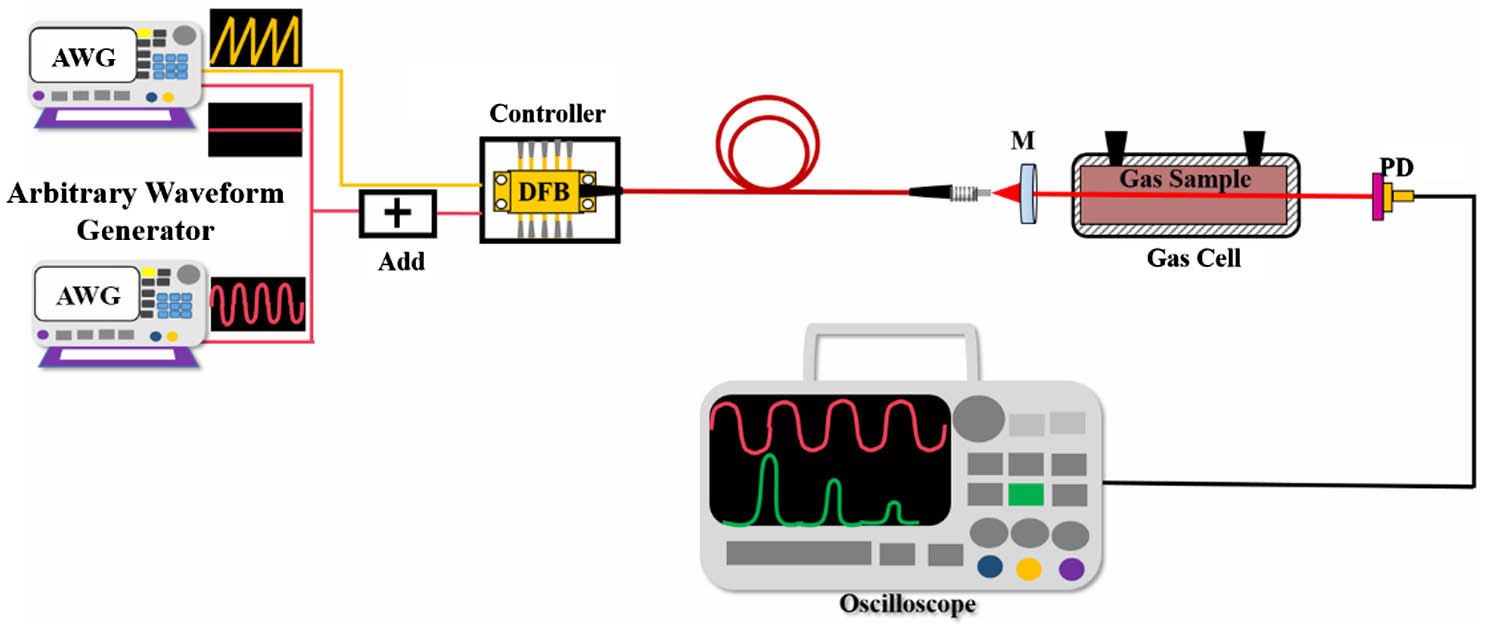
    Fig. 1. Experimental setup for the validation of the proposed method.
    (a)–(d) Represent the simulated process of extracting second harmonic using the WMS method. (b), (e)–(g) Represent the simulated process of extracting second harmonic using the FFT-WMS method.
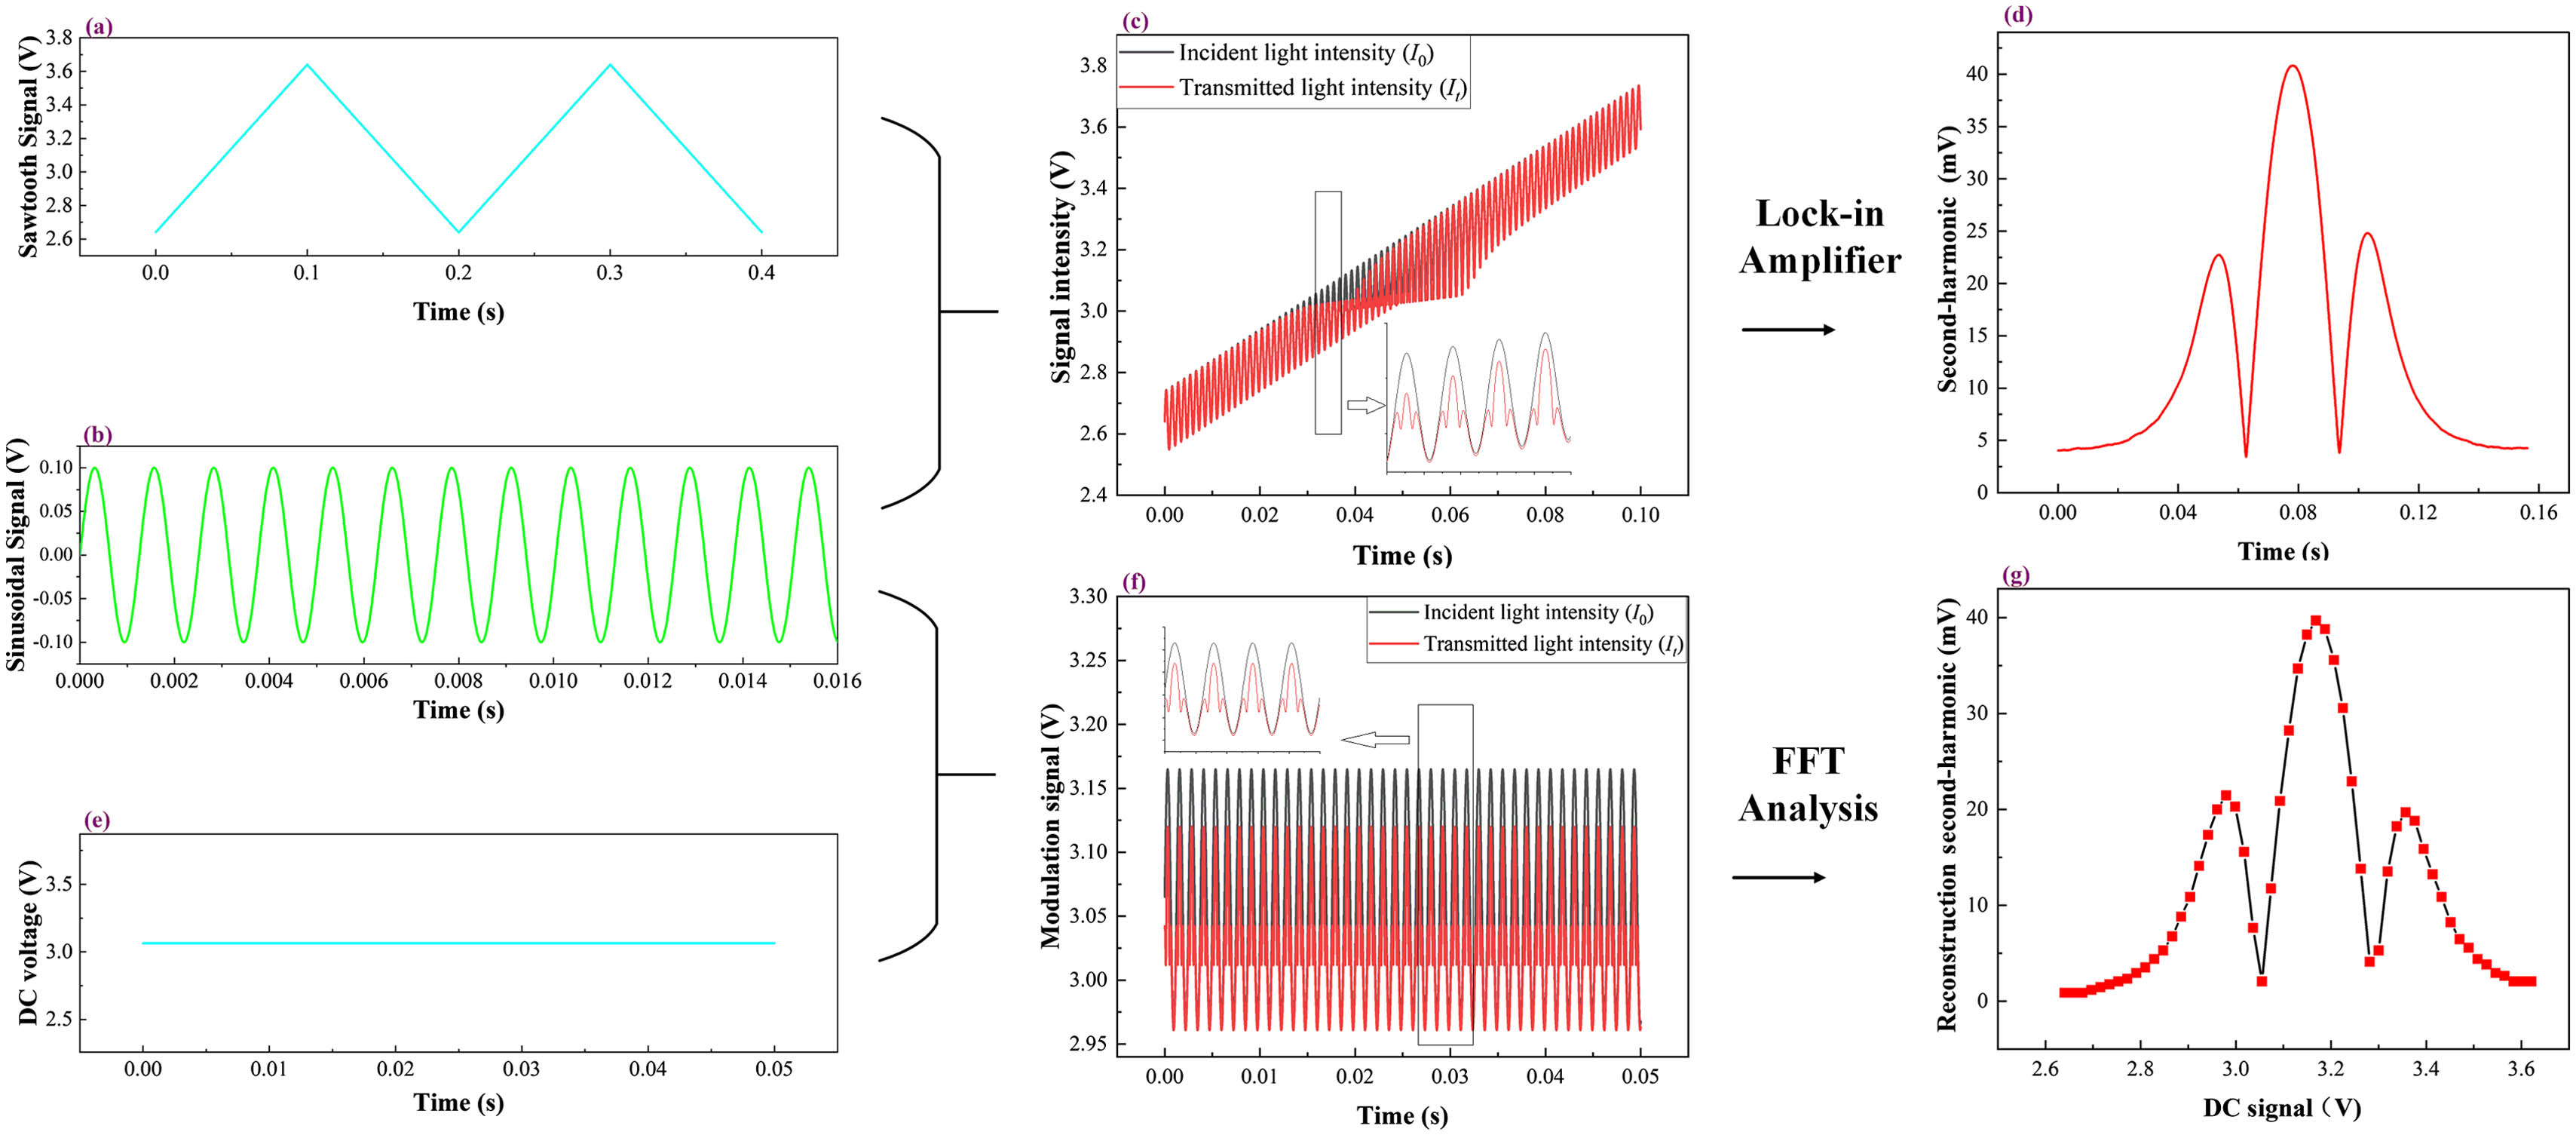
    Fig. 2. (a)–(d) Represent the simulated process of extracting second harmonic using the WMS method. (b), (e)–(g) Represent the simulated process of extracting second harmonic using the FFT-WMS method.
    (a) Second-harmonic signal extracted from the lock-in amplifier using the WMS method. (b) Second-harmonic signal reconstructed by FFT-WMS.
    Fig. 3. (a) Second-harmonic signal extracted from the lock-in amplifier using the WMS method. (b) Second-harmonic signal reconstructed by FFT-WMS.
    Relationship between the peak value of the second-harmonic signal and the gas concentration under FFT-WMS.
    Fig. 4. Relationship between the peak value of the second-harmonic signal and the gas concentration under FFT-WMS.
     FFT-WMSWMS
    Conc (%)Derived Conc (%)Error (%)Derived Conc (%)Error (%)
    5.005.142.874.94−1.12
    10.009.97−0.279.58−4.23
    15.0014.78−1.4915.684.50
    20.0020.160.8020.251.24
    25.0024.67−1.3124.62−1.52
    30.0030.200.6729.94−0.21
    Table 1. Comparison of Concentration Results Measured by Two Methods
    Linquan Lai, Yue Chen, Kongtao Chen, Jiale Tang, Kaiwen Yin, Fuqiang Jia, Dun Qiao, Yuanlong Fan, Kang Li, Nigel Copner. Reconstruction and fitting of second-harmonic signals by wavelength modulation spectroscopy method based on fast Fourier transform[J]. Chinese Optics Letters, 2022, 20(9): 093001
    Download Citation