• Advanced Photonics
  • Vol. 3, Issue 2, 026004 (2021)
Herve Hugonnet1、2, Yeon Wook Kim3, Moosung Lee1、2, Seungwoo Shin1、2, Ralph H. Hruban4, Seung-Mo Hong4、5、*, and YongKeun Park1、2、6、*
Author Affiliations
  • 1Korea Advanced Institute of Science and Technology, Department of Physics, Daejeon, Republic of Korea
  • 2KAIST Institute for Health Science and Technology, KAIST, Daejeon, Republic of Korea
  • 3Asan Institute for Life Science, Asan Medical Center, Seoul, Republic of Korea
  • 4Johns Hopkins Medical Institutions, Sol Goldman Pancreatic Cancer Research Center, Department of Pathology, Baltimore, Maryland, United States
  • 5University of Ulsan College of Medicine, Asan Medical Center, Department of Pathology, Seoul, Republic of Korea
  • 6Tomocube Inc., Daejeon, Republic of Korea
  • show less
    DOI: 10.1117/1.AP.3.2.026004 Cite this Article Set citation alerts
    Herve Hugonnet, Yeon Wook Kim, Moosung Lee, Seungwoo Shin, Ralph H. Hruban, Seung-Mo Hong, YongKeun Park. Multiscale label-free volumetric holographic histopathology of thick-tissue slides with subcellular resolution[J]. Advanced Photonics, 2021, 3(2): 026004 Copy Citation Text show less
    Design and mechanism of a custom optical diffraction tomography apparatus. (a) Close-up view of motorized stage; (b) schematic of the optical setup. BS, beam-splitter; L, lens; M, mirror; DMD, digital micromirror device; COND, condenser lens; OBJ, objective lens. (c) Optical diffraction tomography steps: first, a hologram is retrieved by the camera; the amplitude and phase of the field transmitted through the sample are retrieved from this hologram. Finally, the RI map of the sample is obtained. (d)–(g) Stitching algorithm steps: (d) overlapping regions of adjacent tiles are retrieved; (e) phase correlation algorithm output allows retrieval of the subpixel shift between the two overlapping regions; (f) mean square error between the overlapping regions after the subpixel shift correction; (g) small FoVs are raster scanned to form a big FoV; they are then stitched together using the relative position found in (e).
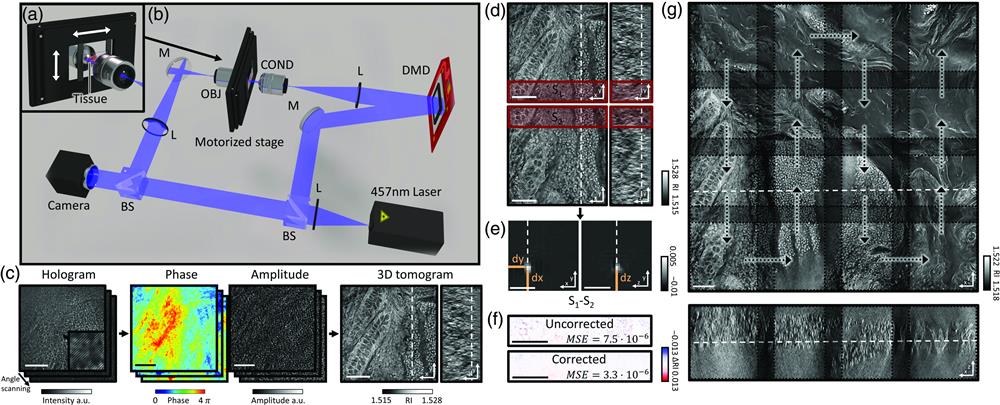
    Fig. 1. Design and mechanism of a custom optical diffraction tomography apparatus. (a) Close-up view of motorized stage; (b) schematic of the optical setup. BS, beam-splitter; L, lens; M, mirror; DMD, digital micromirror device; COND, condenser lens; OBJ, objective lens. (c) Optical diffraction tomography steps: first, a hologram is retrieved by the camera; the amplitude and phase of the field transmitted through the sample are retrieved from this hologram. Finally, the RI map of the sample is obtained. (d)–(g) Stitching algorithm steps: (d) overlapping regions of adjacent tiles are retrieved; (e) phase correlation algorithm output allows retrieval of the subpixel shift between the two overlapping regions; (f) mean square error between the overlapping regions after the subpixel shift correction; (g) small FoVs are raster scanned to form a big FoV; they are then stitched together using the relative position found in (e).
    (a) Schematic of virtual focal planes and holographic refocusing; (b) RI standard deviation as a function of physical depth; (c) cross-sectional images of the reconstructed tomogram (left) with holographic refocusing and (right) without holographic refocusing. (d) Schematic of the stitching and focus finding steps. Scale bars are 100 μm long.
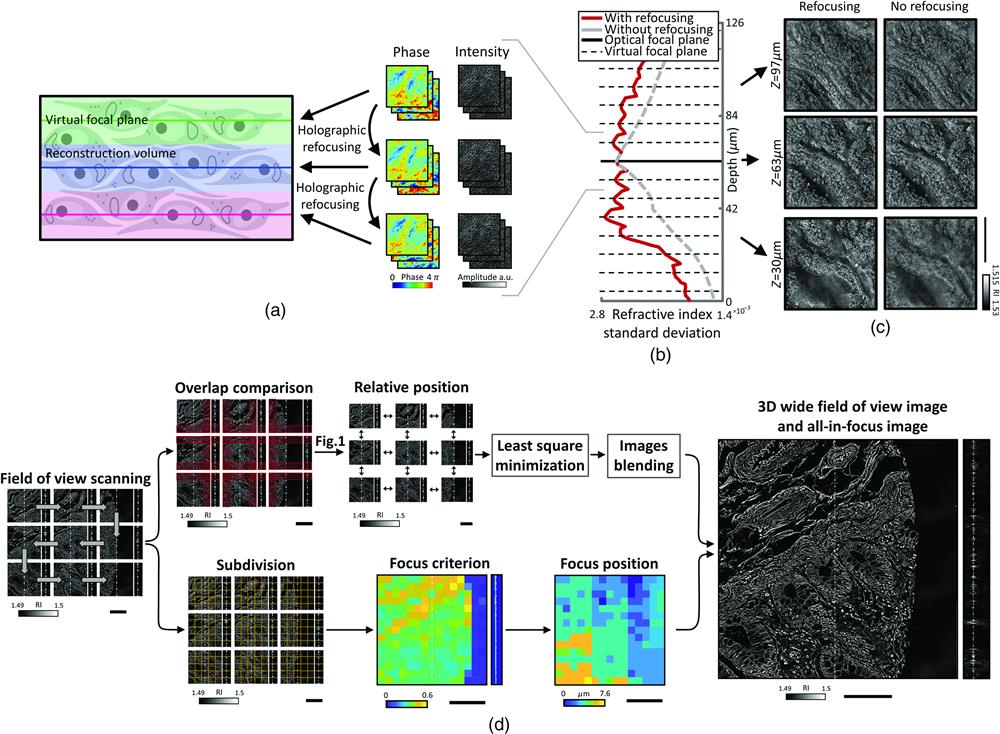
    Fig. 2. (a) Schematic of virtual focal planes and holographic refocusing; (b) RI standard deviation as a function of physical depth; (c) cross-sectional images of the reconstructed tomogram (left) with holographic refocusing and (right) without holographic refocusing. (d) Schematic of the stitching and focus finding steps. Scale bars are 100  μm long.
    (a) Comparison of a normal colon tissue slice imaged with bright field and stained with H&E and (b) an unstained neighbor tissue slice imaged with ODT. In (a), the zoomed in image was taken with a 60× 0.8 NA objective lens, while, in (b), the zoomed in image is a cropped version of the stitched image. (c)–(e) 3D wide field images of 100-μm-thick tissue slices of (c) pancreas, (d) colon, and (e) small intestine. Zoomed in regions of interest are shown at different depths. Scale bars are 100 μm long in (a), (b) and zoom in from (c)–(e). Scale bars are 500 μm long in wide FoV images of (c)–(e).
    Fig. 3. (a) Comparison of a normal colon tissue slice imaged with bright field and stained with H&E and (b) an unstained neighbor tissue slice imaged with ODT. In (a), the zoomed in image was taken with a 60× 0.8  NA objective lens, while, in (b), the zoomed in image is a cropped version of the stitched image. (c)–(e) 3D wide field images of 100-μm-thick tissue slices of (c) pancreas, (d) colon, and (e) small intestine. Zoomed in regions of interest are shown at different depths. Scale bars are 100  μm long in (a), (b) and zoom in from (c)–(e). Scale bars are 500  μm long in wide FoV images of (c)–(e).
    Volumetric histopathology of unlabeled 100-μm-thick pancreas tissue samples from three individuals: (a) patient with a pancreatic neuroendocrine tumor; (b), (c) patient with pancreatic intraepithelial neoplasia (PanIN); and (d)–(f) patient with IPNB in the liver. The areas indicated with the boxes (i)–(vi) are shown at three different axial positions with magnification (from the second to the fourth rows). For comparison purposes, adjacent tissues were prepared in thin tissue slides with the conventional H&E staining method. (The fifth row, 400× magnification.) Scale bars are 500 μm long in wide FoV images and 50 μm long in zoomed regions of interest.
    Fig. 4. Volumetric histopathology of unlabeled 100-μm-thick pancreas tissue samples from three individuals: (a) patient with a pancreatic neuroendocrine tumor; (b), (c) patient with pancreatic intraepithelial neoplasia (PanIN); and (d)–(f) patient with IPNB in the liver. The areas indicated with the boxes (i)–(vi) are shown at three different axial positions with magnification (from the second to the fourth rows). For comparison purposes, adjacent tissues were prepared in thin tissue slides with the conventional H&E staining method. (The fifth row, 400× magnification.) Scale bars are 500  μm long in wide FoV images and 50  μm long in zoomed regions of interest.
    Herve Hugonnet, Yeon Wook Kim, Moosung Lee, Seungwoo Shin, Ralph H. Hruban, Seung-Mo Hong, YongKeun Park. Multiscale label-free volumetric holographic histopathology of thick-tissue slides with subcellular resolution[J]. Advanced Photonics, 2021, 3(2): 026004
    Download Citation