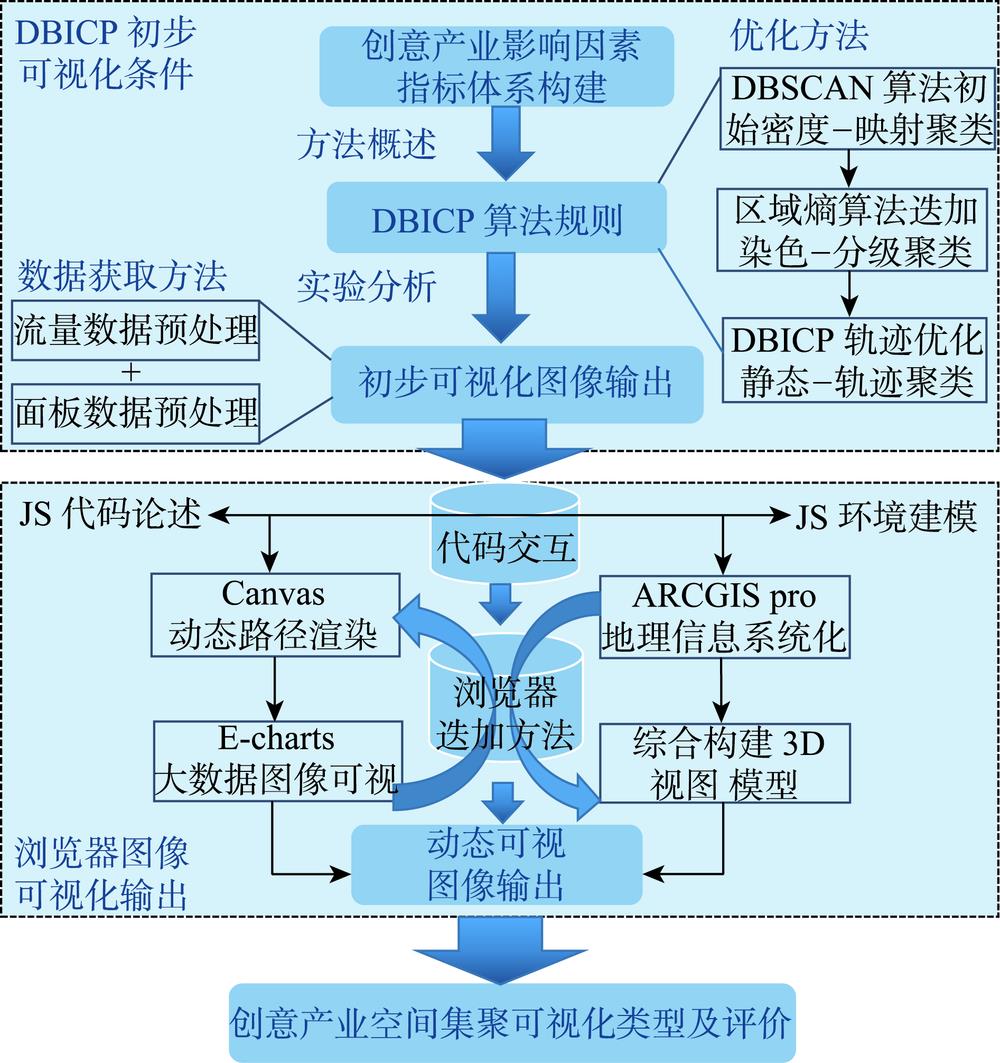

Qi ZHOU, Changchun GAO. The Calculation and Visual Optimization Method of Spatial Dynamic Agglomeration Evolution of Urban Creative Industries [J]. Journal of Geo-information Science, 2020, 22(5): 1033
- Journal of Geo-information Science
- Vol. 22, Issue 5, 1033 (2020)
Abstract

Set citation alerts for the article
Please enter your email address
© Copyright 2018-2021 | Chinese Laser Press. All Rights Reserved 沪ICP备15018463号-20