
Yaojun Li, Jie Feng, Wenzhao Wang, Junhao Tan, Xulei Ge, Feng Liu, Wenchao Yan, Guoqiang Zhang, Changbo Fu, Liming Chen. Micro-size picosecond-duration fast neutron source driven by a laser–plasma wakefield electron accelerator[J]. High Power Laser Science and Engineering, 2022, 10(5): 05000e33
- High Power Laser Science and Engineering
- Vol. 10, Issue 5, 05000e33 (2022)
Abstract
1 Introduction
Laser–plasma accelerators have attracted significant interest over the last few decades[1–4] due to their high acceleration gradients and beam currents[5]; they not only enable GeV electron[6] and hundred-MeV ion[7] accelerators to be reduced to a length scale of centimeters, but also can drive secondary radiation[8–10] and particle sources[11–14] with ultra-high brightness/flux. For example, laser–plasma accelerating electrons/ions can induce photofission[15], spallation[16] and fusion[13] reactions, and generate a fast neutron source[14]. Because of the uncharged property of neutrons, they have different properties from charged particles or electromagnetic radiation when interacting with matter, which can result in obtaining complementary information. In recent decades, neutron sources have been widely used in many fields, such as nuclear physics[17], biology[18], archaeology[19] and medical science[20].
Compared with traditional spallation[21–23] and fusion neutron source[24–26], a laser–plasma accelerator driving a neutron source has some advantages, such as being compact[27] and having an ultra-short pulse duration[14] and an ultra-high peak flux[13,28]. This novel neutron source has great potential to further improve the quality of fast neutron resonance radiography (FNRR)[29–32] and fast neutron absorption spectroscopy (FNAS)[33]. In laser-based neutron experiments, great efforts have been made to realize a high repetition rate, high flux and high yield neutron source[34–36]. A high yield and a collimated neutron source (
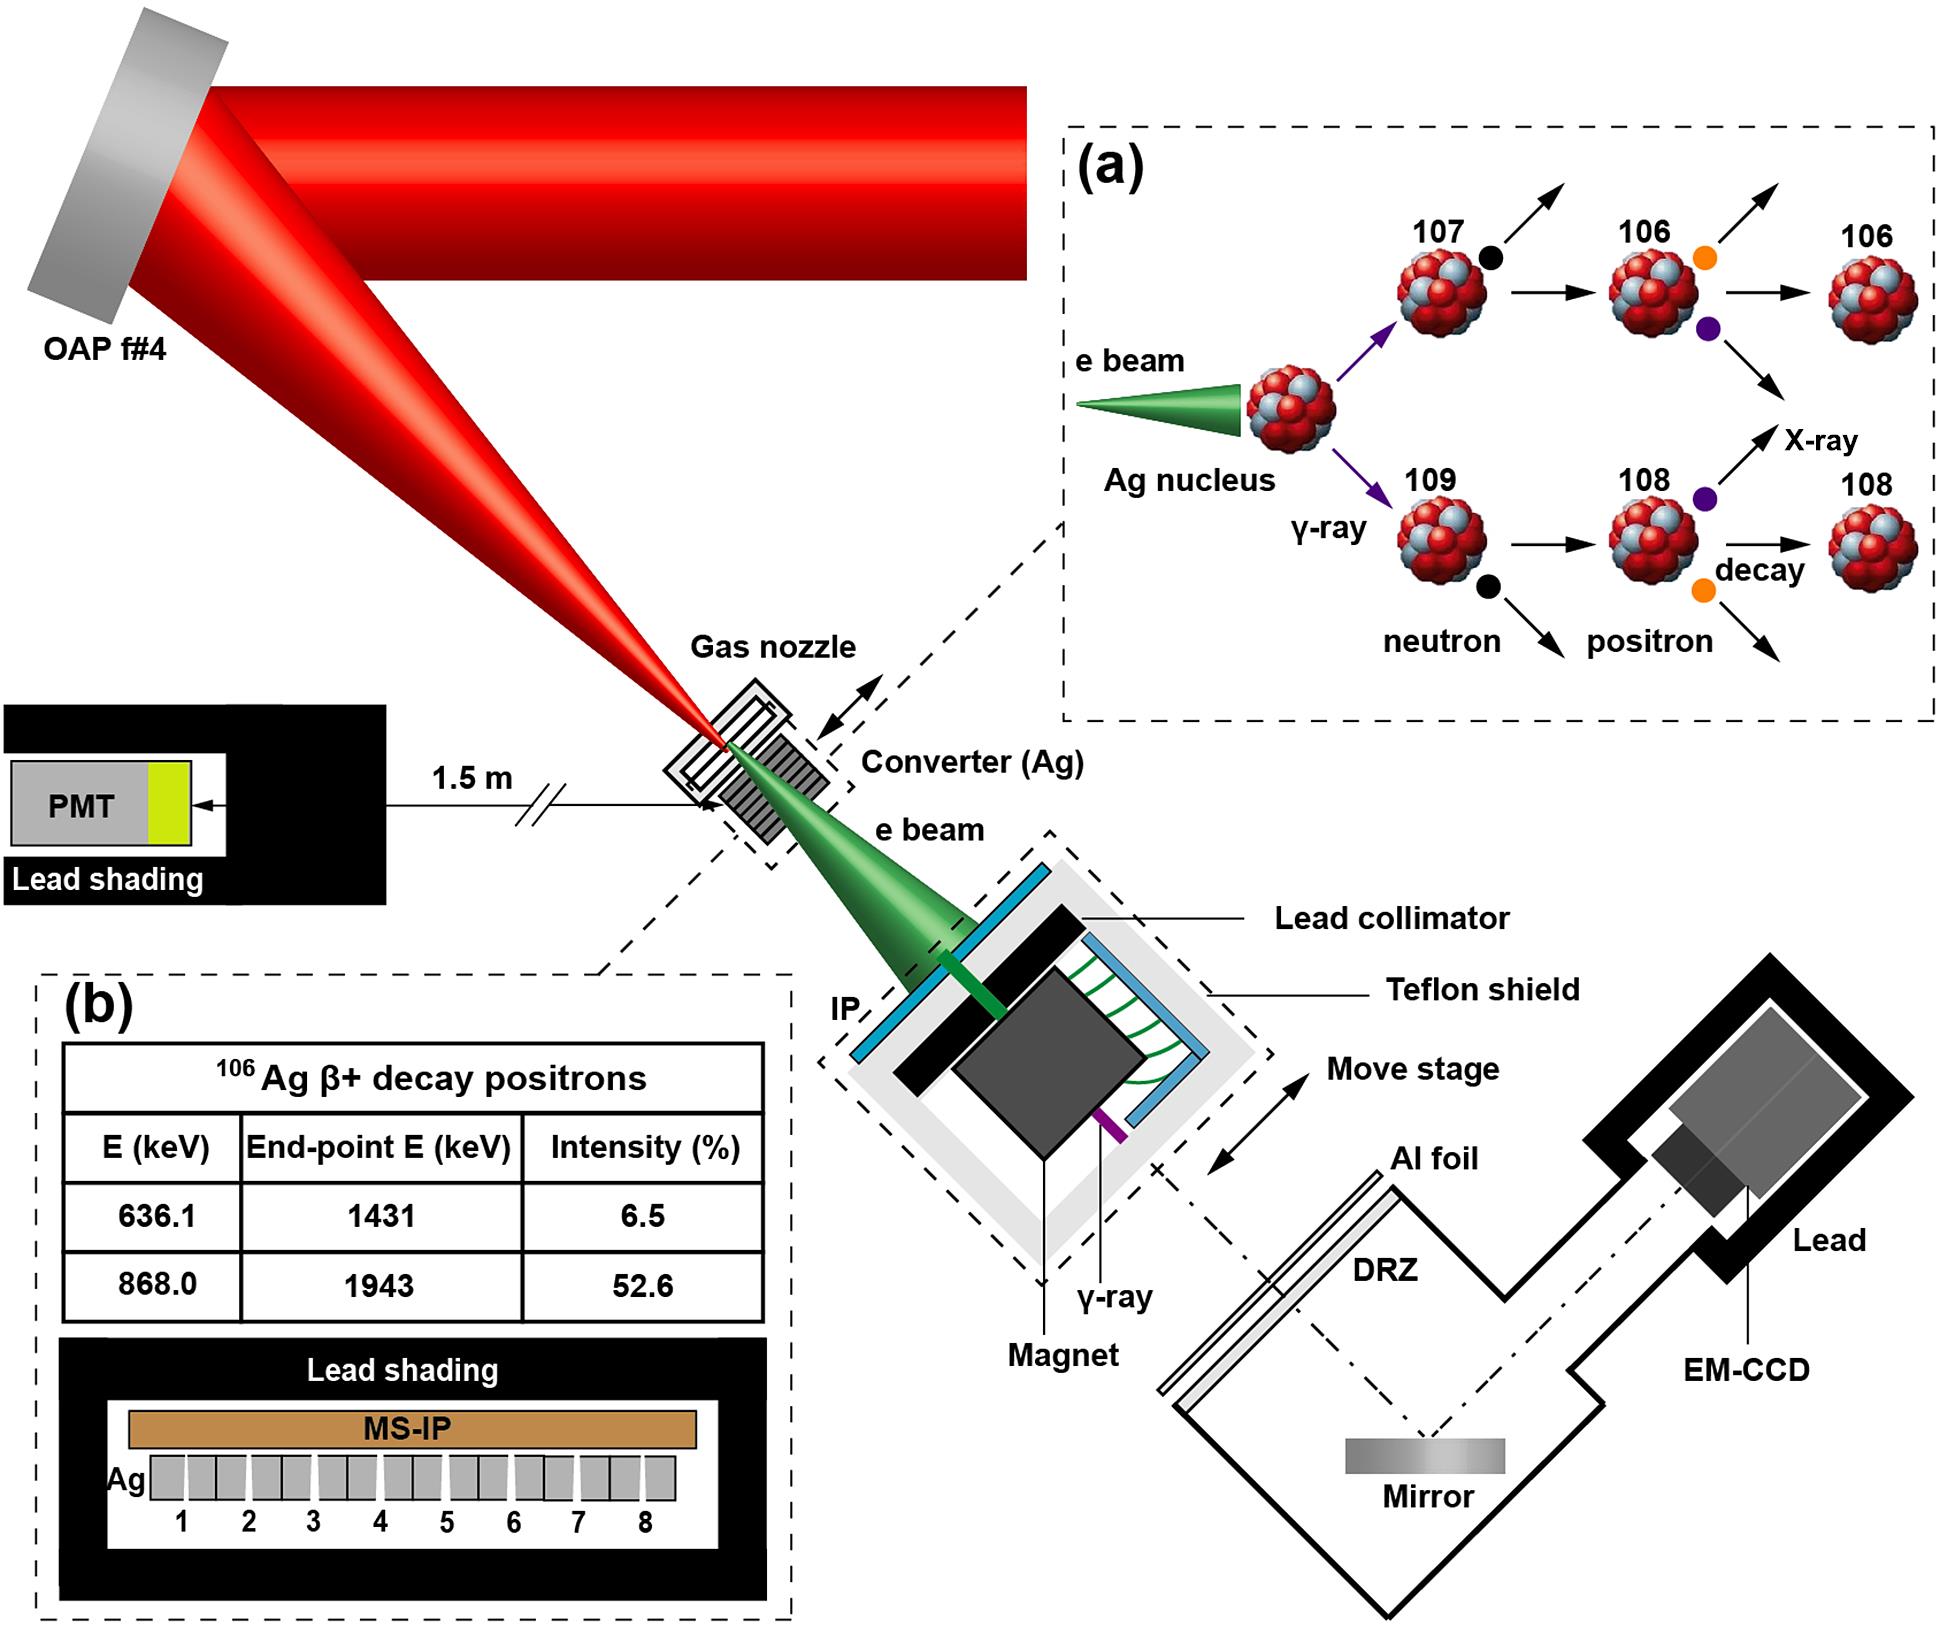
Figure 1.Experimental setup. (a) Schematic diagram of photo-nuclear reactions for  Ag and
  Ag atoms. (b)
  Ag decay products, and schematic diagram of the measurement of neutron source spatial distribution.
In this work, we proposed a method to measure the spatial intensity distribution of the neutron source, and demonstrated experimentally the optimization of the neutron source size and pulse duration via a large charge collimated electron beam from an LWFA driving photofission reactions. A micro-size, ultra-short pulsed fast neutron source is obtained by optimizing the thin metal converter position to the gas nozzle. This optimized neutron source is of great value to improve the imaging spatial resolution of FNRR and to realize finer FNAS.
Sign up for High Power Laser Science and Engineering TOC. Get the latest issue of High Power Laser Science and Engineering delivered right to you!Sign up now
2 Experimental setup
The experiment was performed at the Laboratory for Laser Plasma in Shanghai Jiao Tong University using the 100 TW laser system and a Ti:sapphire laser with the central wavelength of 800 nm. In the experiment, the system delivered 3 J p-polarized pulses with duration of 45 fs (full width at half maximum, FWHM). The experimental setup is shown in Figure 1. The laser beam was focused by an f/4 off-axis parabolic mirror, and the intensity in the focal plane was close to Gaussian distribution with a radius
A stack of silver (Ag) plates with a total thickness of 1.6 cm was placed at the downstream of the gas jet. When the electron beam bombards the Ag target, the generated bremsstrahlung
![]()
Figure 2.Experimental results of the electron beam at plasma density of 3.68 cm
cm . (a) Electron beam angular distribution (PSL value). (b) Electron beam energy spectrum of 10 continuous shots. (c) Electron beam divergence angle of 70 continuous shots. (d) Electron beam charge.
3 Results of laser–plasma wakefield acceleration electron beams
In order to generate a large charge and collimated energetic electron beam, we scan the nitrogen gas density. Due to the plasma bubble radius
![]()
Figure 3.Experimental results of neutron source spatial distribution. (a) Positron distributions of eight-piece silver plates. (b) Deduced neutron source on-axis distribution from the first silver plate. (c) Variation of neutron source size and positron charge with silver converter depth.
![]()
Figure 4.Optimized results of neutron source size. (a) Positron distribution comes from the front side of the Ag converter with 500 μm thickness. (b) Positron distribution comes from the back side. (c) Neutron time of flight spectrum. (d) Neutron energy spectrum.
4 Results of micro-source-size neutrons
4.1 Spatial distribution of the neutron source
In order to acquire the neutron source spatial intensity distribution, the optimized electron beam (Figure 2) is utilized to bombard the Ag stack, which is composed of eight-piece 200 μm silver plates and is placed 5 mm away from the rear edge of the gas nozzle. After the stack is irradiated by 20 electron beams at shooting repetition rate of 0.025 Hz, these Ag plates become activated via photofission reaction. The spatial distribution of the neutron source is deduced by measuring the distribution of activated products
The distributions of positrons in the eight Ag plates are shown in Figure 3(a), and these pictures are lined up from top to bottom along the electron beam propagation direction. According to the positron distribution on an Ag plate, the transverse distribution of the neutrons can be deduced, for example, see Figure 3(b), which is from Figure 3(a) P1. Therefore, the transverse size distribution of the neutron source at different depths can be reconstructed by positron distributions on different Ag plates, as shown in Figure 3(c). The neutron source transversal size increases quickly to approximately 3 mm (FWHM) due to the electron beam diverging in the converter within 600 μm depth, and then it decreases to approximately 1 mm due to the lower energy electrons quickly depositing in the converter and the higher energy wakefield electrons having smaller divergence[5]. Moreover, according to the positron charges from different Ag plates, the neutron source longitudinal distribution can be reconstructed as shown in Figure 3(c) (red line) . Due to the positrons being accumulated from one piece of activated
![]()
Figure 5.Energy resolutions for different neutron pulse durations: (a) 1 ns; (b) 36 ps.
4.2 Optimization of the neutron source size
The neutron source obtained with the above parameters of the converter has a transversal size of less than 3 mm (FWHM) and a longitudinal length of approximately 700 μm (FWHM). To further optimize the neutron source size, a thinner (500 μm) Ag converter is placed closer to the edge of the gas nozzle without affecting the process of the LWFA. The positron distributions measured from the front and back sides of the converter are shown in Figures 4(a) and 4(b), respectively. The optimized neutron transversal source size is less than 500 μm in FWHM, which fits well with the Gaussian distribution. The transversal size from the front side is slightly smaller than from the back. Moreover, the positron intensity measured from the back side is about 1.5 times higher than that from the front side, and thus the longitudinal source size can be approximately regarded as the target thickness (500 μm).
In order to acquire the pulsed neutron source duration and yield, a plastic scintillator detector is utilized to measure the neutron time of flight (TOF) spectrum, which is shown in Figure 4(c), and its experimental layout is shown in Figure 1. Due to the
5 Discussion
FNRR and FNAS have been widely used in security[53], industry[54], special medical materials[55], etc. FNRR is an imaging method that exploits the characteristic cross-section structures of different isotopes in the energy range of fast neutrons. When an inspected object is irradiated and it contains elements that possess sharp cross-section resonances, the transmitted FNAS will exhibit dips and peaks at specific energies that can reveal the elemental compositions and their distributions[31,32]. However, because of the fast neutron transversal source size, for example, spallation neutron source (mm–cm)[21], and the neutron source being based on a linear accelerator (~mm)[24,56], the fast neutron radiography spatial resolution is usually limited to approximately of the order of mm. Here, the micro-size fast neutron source driven by the LWFA could improve the spatial resolution to hundreds of μm. More significantly, the pulse duration of the LWFA-based fast neutron is ultra-short and can be less than 100 ps, which has the potential to improve the state of the art of energy resolution (
The energy resolution of FNAS is usually determined by three facts, namely the detector timing resolution, detection distance and neutron pulse duration. At present, the scintillator BaF
6 Conclusion
In summary, we have presented a method for generating a micro-size ultra-short pulsed neutron source via laser wakefield acceleration electron beam bombarding a thin metal converter, and also a method for measuring this neutron source spatial distribution by using the positrons emitted from the activated silver stack converter. A large charge of approximately 20 nC, tens of MeV, collimated electron beam has been produced via a tightly focused approximately 100 TW laser pulse transversely matched in dense plasma. Then, an ultra-short (
References
[1] T. Tajima, J. M. Dawson. Phys. Rev. Lett., 43, 267(1979).
[2] S. P. D. Mangles, C. D. Murphy, Z. Najmudin, A. G. R. Thomas, J. L. Collier, A. E. Dangor, E. J. Divall, P. S. Foster, J. G. Gallacher, C. J. Hooker, D. A. Jaroszynski, A. J. Langley, W. B. Mori, P. A. Norreys, F. S. Tsung, R. Viskup, B. R. Walton, K. Krushelnick. Nature, 431, 535(2004).
[3] C. G. Geddes, C. S. Toth, J. Van Tilborg, E. Esarey, C. B. Schroeder, D. Bruhwiler, C. Nieter, J. Cary, W. P. Leemans. Nature, 431, 538(2004).
[4] J. Faure, Y. Glinec, A. Pukhov, S. Kiselev, S. Gordienko, E. Lefebvre, J.-P. Rousseau, F. Burgy, V. Malka. Nature, 431, 541(2004).
[5] Y. F. Li, D. Z. Li, K. Huang, M. Z. Tao, M. H. Li, J. R. Zhao, Y. Ma, X. Guo, J. G. Wang, M. Chen, N. Hafz, J. Zhang, L. M. Chen. Phys. Plasmas, 24, 023108(2017).
[6] A. J. Gonsalves, K. Nakamura, J. Daniels, C. Benedetti, C. Pieronek, T. C. H. de Raadt, S. Steinke, J. H. Bin, S. S. Bulanov, J. van Tilborg, C. G. R. Geddes, C. B. Schroeder, C. Tóth, E. Esarey, K. Swanson, L. Fan-Chiang, G. Bagdasarov, N. Bobrova, V. Gasilov, G. Korn, P. Sasorov. Phys. Rev. Lett., 122, 084801(2019).
[7] A. Macchi, M. Borghesi, M. Passoni. Rev. Mod. Phys., 85, 751(2013).
[8] A. Rousse, K. T. Phuoc, R. Shah, A. Pukhov, E. Lefebvre, V. Malka, S. Kiselev, F. Burgy, J.-P. Rousseau, D. Umstadter, D. Hulin. Phys. Rev. Lett., 93, 135005(2004).
[9] A. Giulietti, N. Bourgeois, T. Ceccotti, X. Davoine, S. Dobosz, P. D’Oliveira, M. Galimberti, J. Galy, A. Gamucci, D. Giulietti, L. A. Gizzi, D. J. Hamilton, E. Lefebvre, L. Labate, J. R. Marquès, P. Monot, H. Popescu, F. Réau, G. Sarri, P. Tomassini, P. Martin. Phys. Rev. Lett., 101, 105002(2008).
[10] W. C. Yan, C. Fruhling, G. Golovin, D. Haden, J. Luo, P. Zhang, B. Zhao, J. Zhang, C. Liu, M. Chen, S. Chen, S. Banerjee, D. Umstadter. Nat. Photonics, 11, 514(2017).
[11] T. Ditmire, J. Zweiback, V. P. Yanovsky, T. E. Cowan, G. Hays, K. B. Wharton. Nature, 398, 489(1999).
[12] W. Bang, M. Barbui, A. Bonasera, H. J. Quevedo, G. Dyer, A. C. Bernstein, K. Hagel, K. Schmidt, E. Gaul, M. E. Donovan, F. Consoli, R. De Angelis, P. Andreoli, M. Barbarino, S. Kimura, M. Mazzocco, J. B. Natowitz, T. Ditmire. Phys. Rev. E, 88, 033108(2013).
[13] M. Roth, D. Jung, K. Falk, N. Guler, O. Deppert, M. Devlin, A. Favalli, J. Fernandez, D. Gautier, M. Geissel, R. Haight, C. E. Hamilton, B. M. Hegelich, R. P. Johnson, F. Merrill, G. Schaumann, K. Schoenberg, M. Schollmeier, T. Shimada, T. Taddeucci, J. L. Tybo, F. Wagner. Phys. Rev. Lett., 110, 044802(2013).
[14] I. Pomerantz, E. McCary, A. R. Meadows, A. Arefiev, A. C. Bernstein, C. Chester, J. Cortez, M. E. Donovan, G. Dyer, E. W. Gaul, D. Hamilton, D. Kuk, A. C. Lestrade, C. Wang, T. Ditmire, B. M. Hegelich. Phys. Rev. Lett., 113, 184801(2014).
[15] J. Feng, C. Fu, Y. Li, X. Zhang, J. Wang, D. Li, C. Zhu, J. Tan, M. Mirzaie, Z. Zhang, L. Chen. High Energy Density Phys., 36, 100753(2020).
[16] B. Martinez, S. N. Chen, S. Bolanos, N. Blanchot, G. Boutoux, W. Cayzac, C. Courtois, X. Davoine, A. Duval, V. Horny, I. Lantuejoul, L. Le Deroff, P. E. Masson-Laborde, G. Sary, B. Vauzour, R. Smets, L. Gremillet, J. Fuchs. Matter Radiat. Extremes, 7, 024401(2022).
[17] H. Feshbach, E. Sheldon. Phys. Today, 30, 40(1977).
[18] S. Krueger, C. W. Meuse, C. F. Majkrzak, J. A. Dura, N. F. Berk, M. Tarek, A. L. Plant. Langmuir, 17, 511(2001).
[19] N. Kardjilov, F. Fiori, G. Giunta, A. Hilger, F. Rustichelli, M. Strobl, J. Banhart, R. Triolo. J. Neutron Res., 14, 29(2006).
[20] Z. G. Biochemistry. Science, 288, 1604(2000).
[21] F. Wang, T. Liang, W. Yin, Q. Yu, L. He, J. Tao, T. Zhu, X. Jia, S. Zhang. Sci. China Phys. Mech. Astronom., 56, 2410(2013).
[22] K. van der Meer, M. B. Goldberg, E. H. Lehmann, H. A. Abderrahim, D. Bar, D. Berkovits, M. Daum, S. Dekelver, Y. Foucher, J. Gerber, F. Van Gestel, W. Hajdas, H. P. Linder, E. Malambu, I. Mardor, J. Oeyen, D. Saphier, A. Shor, M. Willekens, Y. Yariv. Nucl. Instrum. Methods B, 217, 202(2004).
[23] H. Takada, K. Haga, M. Teshigawara, T. Aso, S. I. Meigo, H. Kogawa, T. Naoe, T. Wakui, M. Ooi, M. Harada, M. Futakawa. Quantum Beam Sci., 1, 8(2017).
[24] B. V. Kuteev, P. R. Goncharov, V. Y. Sergeev, V. I. Khripunov. Plasma Phys. Rep., 36, 281(2010).
[25] J. T. Cremer, D. L. Williams, C. K. Gary, M. A. Piestrup, D. R. Faber, M. J. Fuller, J. H. Vainionpaa, M. Apodaca, R. H. Pantell, J. Feinstein. Nucl. Instrum. Methods Phys. Res. A, 675, 51(2012).
[26] J. Knaster, A. Ibarra, J. Abal, A. Abou-Sena, F. Arbeiter, F. Arranz, J. M. Arroyo, E. Bargallo, P.-Y. Beauvais, D. Bernardi, N. Casal, J. M. Carmona, N. Chauvin, M. Comunian, O. Delferriere, A. Delgado, P. Diaz-Arocas, U. Fischer, M. Frisoni, A. Garcia, P. Garin, R. Gobin, P. Gouat, F. Groeschel, R. Heidinger, M. Ida, K. Kondo, T. Kikuchi, T. Kubo, Y. Le Tonqueze, W. Leysen, A. Mas, V. Massaut, H. Matsumoto, G. Micciche, M. Mittwollen, J. C. Mora, F. Mota, P. A. P. Nghiem, F. Nitti, K. Nishiyama, F. Ogando, S. O’hira, C. Oliver, F. Orsini, D. Perez, M. Perez, T. Pinna, A. Pisent, I. Podadera, M. Porfiri, G. Pruneri, V. Queral, D. Rapisarda, R. Roman, M. Shingala, M. Soldaini, M. Sugimoto, J. Theile, K. Tian, H. Umeno, D. Uriot, E. Wakai, K. Watanabe, M. Weber, M. Yamamoto, T. Yokomine. Nucl. Fusion, 55, 086003(2015).
[27] S. R. Mirfayzi, A. Alejo, H. Ahmed, D. Raspino, S. Ansell, L. A. Wilson, C. Armstrong, N. M. H. Butler, R. J. Clarke, A. Higginson, J. Kelleher, C. D. Murphy, M. Notley, D. R. Rusby, E. Schooneveld, M. Borghesi, P. McKenna, N. J. Rhodes, D. Neely, C. M. Brenner, S. Kar. Appl. Phys. Lett., 111, 044101(2017).
[28] A. Alejo, A. G. Krygier, H. Ahmed, J. T. Morrison, R. J. Clarke, J. Fuchs, A. Green, J. S. Green, D. Jung, A. Kleinschmidt, Z. Najmudin, H. Nakamura, P. Norreys, M. Notley, M. Oliver, M. Roth, L. Vassura, M. Zepf, M. Borghesi, R. R. Freeman, S. Kar. Plasma Phys. Contr. Fusion, 59, 064004(2017).
[29] J. C. Overley. Int. J. Appl. Radiat. Isot., 36, 185(1985).
[30] G. Y. Chen, R. C. Lanza, J. Hall. Appl. Accelerators Res. Industry, 576, 1109(2001).
[31] D. Vartsky, I. Mor, M. B. Goldberg, D. Bar, G. Feldman, V. Dangendorf, K. Tittelmeier, M. Weierganz, B. Bromberger, A. Breskinc. Nucl. Instrum. Methods A, 623, 603(2010).
[32] M. Ooi, M. Teshigawara, T. Kai, M. Harada, F. Maekawa, M. Futakawa, E. Hashimoto, M. Segawa, M. Kureta, A. Tremsin, T. Kamiyama, Y. Kiyanagi. Phys. Procedia, 43, 337(2013).
[33] I. D. Hau, T. R. Niedermayr, O. B. Drury, A. Burger, Z. Bell, S. Friedrich. Nucl. Instrum. Methods A, 559, 745(2006).
[34] M. Hohenberger, N. B. Meezan, W. M. Riedel, N. Kabadi, C. J. Forrest, L. Aghaian, M. A. Cappelli, M. Farrell, S. H. Glenzer, B. Heeter, R. Heredia, O. L. Landen, A. J. Mackinnon, R. Petrasso, C. M. Shuldberg, F. Treffert, W. W. Hsing. Rev. Sci. Instrum., 92, 033544(2021).
[35] W. Qi, X. H. Zhang, B. Zhang, S. K. He, F. Zhang, B. Cui, M. Yu, Z. Dai, X. Peng, Y. Gu. Phys. Plasmas, 26, 043103(2019).
[36] D. Jung, L. Yin, D. C. Gautier, H. C. Wu, S. Letzring, B. Dromey, R. Shah, S. Palaniyappan, T. Shimada, R. P. Johnson, J. Schreiber, D. Habs, J. C. Fernandez, B. M. Hegelich, B. J. Albright. Phys. Plasmas, 20, 056706(2013).
[37] S. R. Mirfayzi, A. Yogo, Z. Lan, T. Ishimoto, A. Iwamoto, M. Negata, M. Nakai, Y. Arikawa, Y. Abe, D. Golovin, Y. Honoki, T. Mori, K. Okamoto, S. Shokita, D. Neely, S. Fujioka, K. Mima, H. Nishimura, S. Kar, R. Kodama. Sci. Rep., 10, 20157(2020).
[38] E. Brunetti, R. P. Shanks, G. G. Manahan, M. R. Islam, B. Ersfeld, M. P. Anania, S. Cipiccia, R. C. Issac, G. Raj, G. Vieux, G. H. Welsh, S. M. Wiggins, D. A. Jaroszynski. Phys. Rev. Lett., 105, 215007(2010).
[39] B. Mahieu, N. Jourdain, K. T. Phuoc, F. Dorchies, J. P. Goddet, A. Lifschitz, P. Renaudin, L. Lecherbourg. Nat. Commun., 9, 3276(2018).
[40] A. R. Maier, N. M. Delbos, T. Eichner, L. Hubner, S. Jalas, L. Jeppe, S. W. Jolly, M. Kirchen, V. Leroux, P. Messner, M. Schnepp, M. Trunk, P. A. Walker, C. Werle, P. Winkler. Phys. Rev., 10, 031039(2020).
[41] X. J. Jiao, J. M. Shaw, T. Wang, X. M. Wang, H. Tsai, P. Poth, I. Pomerantz, L. A. Labun, T. Toncian, M. C. Downer, B. M. Hegelich. Matter Radiat. Extrem., 2, 296(2017).
[42] J. Feng, Y. Li, J. Wang, D. Li, C. Zhu, J. Tan, X. Geng, F. Liu, L. Chen. High Power Laser Sci. Eng, 9, e5(2021).
[43] T. Hosokai. Advanced Accelerator Concepts, 628(2002).
[44] G. J. Williams, B. R. Maddox, H. Chen, S. Kojima, M. Millecchia. Rev. Sci. Instrum., 85, 11E604(2014).
[45] K. A. Tanaka, T. Yabuuchi, T. Sato, R. Kodama, Y. Kitagawa, T. Takahashi, T. Ikeda, Y. Honda, S. Okuda. Rev. Sci. Instrum., 76, 013507(2005).
[46] https://www.nndc.bnl.gov/nudat3/nudat2.jsp. https://www.nndc.bnl.gov/nudat3/nudat2.jsp
[47] W. Lu, M. Tzoufras, C. Joshi, F. S. Tsung, W. B. Mori, J. Vieira, R. A. Fonseca, L. O. Silva. Phys. Rev. Spec. Top. Accelerators Beams, 10, 061301(2007).
[48] A. Pak, K. A. Marsh, S. F. Martins, W. Lu, W. B. Mori, C. Joshi. Phys. Rev. Lett., 104, 025003(2010).
[50] A. L. Meadowcroft, C. D. Bentley, E. N. Stott. Rev. Sci. Instrum., 79, 113102(2008).
[51] H. Chen, N. L. Back, T. Bartal, F. N. Beg, D. C. Eder, A. J. Link, A. G. MacPhee, Y. Ping, P. M. Song, A. Throop, L. V. Woerkom. Rev. Sci. Instrum., 79, 033301(2008).
[52] X. P. Zhang, J. R. Zhao, D. W. Yuan, C. B. Fu, J. Bao, L. M. Chen, J. J. He, L. Hou, L. Li, Y. F. Li, Y. T. Li, G. Q. Liao, Y. Rhee, Y. Sun, S. W. Xu, G. Zhao, B. J. Zhu, J. Q. Zhu, Z. Zhang, J. Zhang. Phys. Rev. C, 96, 055801(2017).
[53] J. C. Overley, M. S. Chmelik, R. J. Rasmussen, R. M. S. Schofield, H. W. Lefevre. Nucl. Instrum. Methods Phys. Res. Sect. B, 99, 728(1995).
[54] N. Takenaka, H. Asano, T. Fujii, M. Mizubata, K. Yoshii. Nucl. Instrum. Methods Phys. Res. Sect. A, 424, 73(1999).
[55] C. L. Fink, B. J. Micklich, T. J. Yule, P. Humm, L. Sagalovsky, M. M. Martin. Nucl. Instrum. Methods Phys. Res. Sect. B, 99, 748(1995).
[56] X. Li, J.-Q. Zhang, G.-Q. Lin, W.-C. Fang, Q. Gu, M. Zhang. Nucl. Sci. Tech., 30, 53(2019).
[57] J. Chen, L. Zhang, R.-Y. Zhu, Y. Du, S. Wang, S. Sun, X. Li. IEEE Trans. Nucl. Sci., 65, 2147(2018).
[58] S. Gundacker, R. H. Pots, A. Nepomnyashchikh, E. Radzhabov, R. Shendrik, S. Omelkov, M. Kirm, F. Acerbi, M. Capasso, G. Paternoster, A. Mazzi, A. Gola, J. Chen, E. Auffray. Phys. Med. Biol., 66, 114002(2021).
[59] F. Ott, S. C. Vogel, J. C. Fernandez, D. C. Gautier, N. Mitura, M. Roth, K. F. Schoenberg, A. Menelle, C. Alba-Simionesco. EPJ Web Conf., 231, 01008(2020).
[60] https://www.nndc.bnl.gov/sigma/index.jsp. https://www.nndc.bnl.gov/sigma/index.jsp

Set citation alerts for the article
Please enter your email address
© Copyright 2018-2021 | Chinese Laser Press. All Rights Reserved 沪ICP备15018463号-20