• Journal of Resources and Ecology
  • Vol. 11, Issue 3, 283 (2020)
Yunfei FENG1, Yingwei DI1, Jing ZHANG2, Xianzhou ZHANG3、*, Peili SHI3, and Ben Niu3
Author Affiliations
  • 1Tangshan Normal University, Tangshan 063000, Hebei, China
  • 2College of Global Change and Earth System Sciences, Beijing Normal University, Beijing 100875, China
  • 3Lhasa Plateau Ecosystem Research Station, Key Laboratory of Ecosystem Network Observation and Modeling, Institute of Geographic Sciences and Natural Resources Research, Chinese Academy of Sciences, Beijing 100101, China
  • show less
    DOI: 10.5814/j.issn.1674-764X.2020.03.005 Cite this Article
    Yunfei FENG, Yingwei DI, Jing ZHANG, Xianzhou ZHANG, Peili SHI, Ben Niu. Impact of Grazing Exclusion on the Surface Heat Balance in North Tibet[J]. Journal of Resources and Ecology, 2020, 11(3): 283 Copy Citation Text show less

    Abstract

    Many recent studies have focused on vegetation feedback to climate systems in sensitive areas like the Qinghai-Tibetan Plateau. Providing allowances and awards to households engaged in animal husbandry that practice grazing exclusion to restore degraded grassland is an important eco-compensation policy effort in China. Grazing exclusion influences grassland variations (Cai et al., 2015). Numerous observational and modelling studies have confirmed that land sur-face conditions play a crucial role in climate change (Pielke et al., 2002; Kalnay and Cai, 2003; Feddema et al., 2005; Pitman and Narisma, 2005; Seneviratne et al., 2006; Pielke et al., 2007). Land surfaces impact the atmosphere through the exchange of energy, momentum, water, carbon dioxide and other gases with the atmospheric boundary layer (Cox et al., 2000; Bounoua et al., 2002).

    1 Introduction

    Many recent studies have focused on vegetation feedback to climate systems in sensitive areas like the Qinghai-Tibetan Plateau. Providing allowances and awards to households engaged in animal husbandry that practice grazing exclusion to restore degraded grassland is an important eco-compensation policy effort in China. Grazing exclusion influences grassland variations (Cai et al., 2015). Numerous observational and modelling studies have confirmed that land sur-face conditions play a crucial role in climate change (Pielke et al., 2002; Kalnay and Cai, 2003; Feddema et al., 2005; Pitman and Narisma, 2005; Seneviratne et al., 2006; Pielke et al., 2007). Land surfaces impact the atmosphere through the exchange of energy, momentum, water, carbon dioxide and other gases with the atmospheric boundary layer (Cox et al., 2000; Bounoua et al., 2002).

    The earth’s climate system tends to be in equilibrium between the absorption of solar radiation and the reflection of surface radiation (Mauritsen et al., 2013). Changes of land cover can affect surface energy distribution by influencing land surface albedo, hydrology and boundary layer roughness. Moreover, changes of land cover types result in different types of changes to the climate. For example, the conversion of large areas of the Amazon rainforest to pasture has resulted in a significant increase in surface temperature and a significant decrease in evaporation and precipitation (Shukla et al., 1990; Malhi et al., 2008). The replacement of natural grassland by irrigated farmland can result in more evapotranspiration and lower surface temperature (Bonfils and Lobell, 2007; Kueppers et al., 2007; Diffenbaugh, 2009; Lobell et al., 2009).

    The ecological environment of the northern Tibetan Plateau is very fragile, and the surface heat balance in this region has great significance for changes in the climate of Asia and even globally (Yang et al., 2014). Studying the effects of changes in land surface characteristics on the surface heat balance in this region can provide an important basis for making predictions about global climate change. Remote sensing data can be used not only to evaluate vegetation changes (Fu et al., 2017; Wu, 2018), but also to ascertain the effect of surface albedo and evapotranspiration on surface heat balance. The various components of an ecosystem have different feedback mechanisms and effects on climate. Land surface conditions can affect convective precipitation by affecting the state of the planetary boundary layer, and the movement of water and energy between land surfaces and the atmosphere (Meng et al., 2014). The positive feedback of vegetation to temperature is related to the feedback of vegetation to albedo in physical properties (Kucharski et al., 2013). Research into the dynamic relationship between the terrestrial biosphere and the atmosphere over a short period of time found that vegetation had positive feedback on climate change by rapidly releasing stored carbon (King and Neilson, 1992). The Tibetan government constructed metal fences to implement grazing exclusions seasonally or year-round to support the recovery of degraded grasslands. Many studies have examined the effectiveness of fencing for grazing exclusion, but find it challenging to understand the effect of mechanisms that impact the surface heat balance. In order to quantify the impact of grazing exclusions on surface heat balance in Tibetan alpine grasslands, satellite data is commonly used. Vegetation can change surface heat balance by affecting albedo and evapotranspiration (Zeng et al., 2017). Therefore, we use data for LST, ET, and albedo, which comprehensive response heat conditions and indicate the changing feedback dynamics caused by grazing exclusions.

    2 Methods and datasets

    2.1 Study area

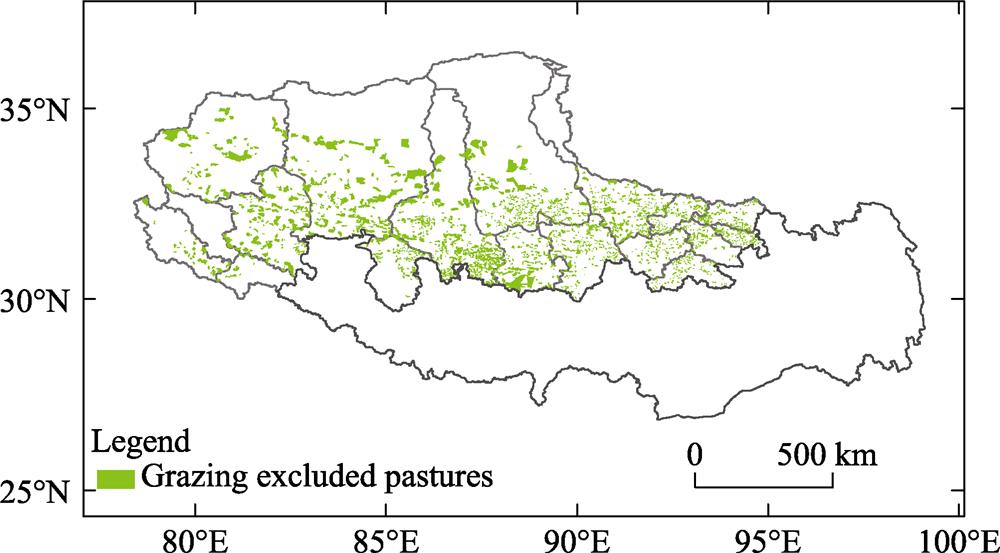
    The northern Tibetan Plateau is located in the northwestern hinterlands of the Qinghai-Tibet Plateau, covers approximately 5.95 × 10⁵ km2, and accounts for nearly 25% of the Qinghai-Tibetan Plateau and 50% of the Tibet Autonomous Region in China. The area is surrounded by the Kunlun, Gangdisi, Tanglha, and Nyainqntanglha mountains. Mean temperature is -11.3 ℃ in the coldest month and 8.4 ℃ in the warmest month in most parts of the northern Tibetan Plateau. Alpine grasslands, including meadows dominated by Kobresia pygmaea, K. humilis and Carex moorcroftii, steppes dominated by Stipa purpurea, S. capillacea and S. subsessiliflora var. basiplumosa, and desert-steppes dominated by S. purpurea, Ceratoides lateens and S. glareosa, are widely distributed on the northern Tibetan Plateau. Alpine grasslands occupy about 70% of the plateau grassland, and are located mostly in the central region (Editorial Board of Vegetation Map of China, 2001).

    Spatial distribution of exclosures for grazing exclusion on the northern Tibetan Plateau

    Figure 1.Spatial distribution of exclosures for grazing exclusion on the northern Tibetan Plateau

    2.2 Datasets

    The MODIS data for LST, ET and albedo products was taken from LP DAAC (Land Processes Distributed Active Archive Center) (https://lpdaac.usgs.gov/get_data/data_pool), The MOD11A2 LSTs, MOD16A2 ETs, and MCD43_GF albedos were taken for the months of May to September in the years 2006 to 2013. A 1 km spatial resolution was used in this study. TIMESAT 2.3 6 was used to calibrate all satellite data for errors caused by adverse atmospheric, radiometric, and geometric conditions. The records of fenced grassland patch locations (Fig. 1), including the longitude, latitude, and elevation of the vertices of each fenced patch (polygon), were provided by the agriculture and animal husbandry bureaus of the counties where the patches were located. ArcGIS 10.2 Desktop was used to create polygon shapes based on patch location records.

    2.3 Data analysis

    In each dataset, a temporal trend across the entire five year study period was calculated with Eqs. (1) and (2) (Stow et al., 2003). slope is the temporal trend of factors, $\bar{s}$ is the average trend of factors over the years, xi is the raster data value in year $i$:

    $slop{{e}_{i}}=\frac{n\times \sum\limits_{i=1}^{n}{(i\times {{x}_{i}})-(\sum\limits_{i=1}^{n}{i)\times \sum\limits_{i=1}^{n}{{{x}_{i}}}}}}{n\times \sum\limits_{i=1}^{n}{{{i}^{2}}-{{(\sum\limits_{i=1}^{n}{i})}^{2}}}}\text{ }$
    ${{\bar{s}}_{i}}={slop{{e}_{i}}}/{\left( \frac{1}{n}\times \sum\limits_{i=1}^{n}{x{}_{i}} \right)}\;$

    The land surface heat balance was calculated with Eq. (3):

    $Sn+Ln=\lambda E+H+G$

    where Sn is the net surface downward shortwave radiation, Ln is the net surface downward longwave radiation, λ is the sensible heat flux due to evapotranspiration, E is the surface evapotranspiration, H is the latent heat flux, and G is the soil heat flux.

    The land surface short-wave radiation was calculated with Eq. (4):

    $Sn\text{ = }S\times \tau \times \text{(1-}\alpha \text{)}$

    where S is the net solar radiation flux at the top of the atmosphere, τ is the transmission of the solar shortwave waves through the atmosphere, and α is the land surface albedo.

    The latent heat flux was calculated with Eq. (5):

    $\lambda \times E=\lambda \times \beta \times Ep$

    where Ep is the potential evapotranspiration, β is the index of evapotranspiration (between 0 and 1), and β is also mean the ratio of actual evapotranspiration to potential evapotranspiration.

    The sensible heat flux was calculated with Eq. (6):

    $H=\rho \times Cd\times \frac{Ts-Ta}{ra}$

    where ρ is the air density, Cd is the specific heat of air at constant pressure, and ra is the aerodynamic resistance at 2 m height.

    The longwave radiation downward($L\downarrow $) was calculated with Eq. (7):

    $L\downarrow =\varepsilon a\times \sigma \times {{T}_{a}}^{4}$

    where σ is the Stephan-Boltzmann constant, Ta is the land surface atmospheric temperature, and $\varepsilon a$ is the factors affected by moisture and cloud cover in the atmosphere.

    The longwave radiation upward($L\uparrow $) was calculated with Eq. (8):

    $L\uparrow =(1-\varepsilon s)\times \varepsilon a\times \sigma \times {{T}_{a}}^{4}+\varepsilon s\times \sigma \times {{T}_{s}}^{4}$

    where $\varepsilon s$is the surface reflectance, Ta is the atmospheric temperature, and Ts is the land surface temperature.

    Through the analysis and integration of Eqs (3) to (8), the surface energy balance was calculated with Eq. (9):

    $\begin{align} 【-逻*辑*与-】amp; \text{ }S\tau \times \text{(1}-\alpha \text{)}-\lambda \times E \text{=}\rho \times Cd\times \frac{Ts-Ta}{ra}-\varepsilon s\times \sigma \times \varepsilon a\times ({{T}_{a}}^{4}-{{T}_{s}}^{4}) \end{align}$

    The main factors that vegetation can cause to change were $\alpha $, E, $\tau $; and the influence of vegetation change on land surface temperature can be rewritten into Eq. (10):

    $\begin{align} \Delta Ts\text{=}\frac{1}{fs}\times \left( -S\tau \times \Delta \alpha -\lambda \times \Delta E\text{+}S\times \text{(1}-\alpha \text{)}\times \Delta \tau +\rho \times \right. \text{ }\left. Cd\times \frac{Ts-Ta}{ra}\times \Delta ra+\varepsilon s\times \sigma \times {{T}_{a}}^{4}\times \Delta \varepsilon a \right) \end{align}$

    where fs is the factor that can impact energy redistribution, mean the sensitivity of land surface temperature to changes in radiation intensity of 1 W m-2, was calculated with Eq. (11):

    $fs=\rho \times Cd/ra+4\times \varepsilon s\times \sigma \times {{T}_{s}}^{4}$

    The change of land surface temperature was calculated with Eq. (12):

    $\begin{align} \Delta Ts\text{=(}4\times \varepsilon \times \sigma \times {{T}_{s}}^{3}{{\text{)}}^{-1}}\times \text{(}-Rsi\times \Delta \alpha \text{+}S\times \text{(1}-\alpha \text{)} \text{ }\times \Delta Rsi+\Delta Rli-\lambda \times \Delta E-\Delta H-\Delta I-\sigma \times {{T}_{s}}^{4}\times \Delta \varepsilon \text{)} \end{align}$

    where Rsi is the downward shortwave radiation, and $Rli$ is the downward longwave radiation. From the above equations (Zeng et al., 2017), the change of land surface temperature can be obtained by calculating the change of surface energy channel.

    3 Results

    3.1 Changes in the LST (Day and Night) of the fenced patches

    Fig. 2 illustrates the changes of daytime and nighttime LST at the fenced patches on the northern Tibetan Plateau. Daytime LST increased noticeably across the northern Tibetan Plateau except in the southwestern area. The warming magnitude of daytime LST in the central region (【-逻*辑*与-】gt;1 ℃ per decade) was the greatest, and that in the eastern region (0.2- 0.5 ℃ per decade) was lower. There were large differences in nighttime LST changes, with cooling in the eastern region (-0.2--0.1 ℃ per decade) and warming in the western region (0.2-0.5 ℃ per decade). In general, the daytime and nighttime LST trends showed an asymmetric diurnal variation, with a larger magnitude of warming during the day than cooling during the night.

    The changes of LST during Day (a) and Night (b) in fenced patches on the northern Tibetan Plateau from May to September in 2006-2013

    Figure 2.The changes of LST during Day (a) and Night (b) in fenced patches on the northern Tibetan Plateau from May to September in 2006-2013

    3.2 Changes in the albedo and evapotranspiration in the fenced patches

    Fig. 3 summarizes the changes of albedo and evapotranspiration on the northern Tibetan Plateau. The albedo noticeably increased by 10% per decade across the northern Tibetan Plateau. The greatest increase (【-逻*辑*与-】gt;10% per decade) occurred in the central region. There were large differences in the amounts of ET changes, with ET noticeably decreasing across the northern Tibetan Plateau, except in the southwestern area.

    Changes of albedo (a) and ET (b) in the fenced patches on the northern Tibetan Plateau from May to September in 2006-2013

    Figure 3.Changes of albedo (a) and ET (b) in the fenced patches on the northern Tibetan Plateau from May to September in 2006-2013

    3.3 Changes of LST caused by the absorption of shortwave radiation

    The effects of albedo changes on surface energy absorption, and especially on the absorption of shortwave radiation, are very important to the surface heat balance. Due to increases of albedo, the absorption of shortwave radiation decreased, and LST decreased on the northern Tibetan Plateau. According to the results of Equation (10), absorption of shortwave radiation led to a maximum LST decrease of -0.5 - -0.4 ℃ per decade in the central region. The minimum decrease (-0.2 - -0.1 ℃ per decade) occurred in the eastern region. The spatial distribution pattern was characterized by a gradual decrease from the center of the region to the peripheries.

    The changes of LST caused by the absorption of shortwave radiation in the fenced patches on the northern Tibetan Plateau from May to September in 2006-2013

    Figure 4.The changes of LST caused by the absorption of shortwave radiation in the fenced patches on the northern Tibetan Plateau from May to September in 2006-2013

    3.4 Changes of LST caused by latent heat

    Due to decreases of ET, the LST increased across the northern Tibetan Plateau, except in the southwestern area. The decrease in ET led to an increase in LST. According to the results of Eq. (10), decreased latent heat led to the central region having the maximum increase of LST (【-逻*辑*与-】gt;1 ℃ per decade). The spatial distribution pattern of increased LST resulting from decreased ET was characterized by a gradual decrease moving from the center of the region to the peripheries. The eastern region increased at a rate of 0.2- 0.5 ℃ per decade, while the minimum increase of 0-0.1 ℃ per decade occurred in the northwestern region. In the southwestern area, LST decreased (-0.2 - -0.1 ℃ per decade).

    Changes of LST caused by latent heat in fenced patches on the northern Tibetan Plateau from May to September in 2006-2013

    Figure 5.Changes of LST caused by latent heat in fenced patches on the northern Tibetan Plateau from May to September in 2006-2013

    4 Discussion

    4.1 Effects of land surface characteristics on surface heat balance

    The Tibetan government has implemented a grazing exclusion program by enclosing large areas of the northern Tibet Plateau with metal fencing. While many studies have focused on the impact this has on biomass and plant diversity (Wu and Fu, 2018), further research using methods such as nonlinear modeling is needed to determine the effectiveness of the fencing (Wu et al., 2017). There has been little research about the effects of fences on surface features. Thus, as a core parameter, land surface control the climate system. Vegetation greening is widely considered to be a major factor influencing changes to the surface heat balance and variability. Vegetation affects land surface albedo, emissivity and soil moisture content, and variations of these factors will change the absorption rate of solar energy and the flux of latent and sensible heat. An earlier study from Kala et al. (2014) argued that the biophysical feedback of vegetation on the surface heat balance was mainly constrained by LAI intensity, and this can control the amount of solar radiation absorbed by land surfaces by changing the surface albedo, and can influence the order of evapotranspiration by vegetation activity (Kala et al., 2014; Zeng et al., 2017). Increased LAI causes both increased evapotranspiration (cooling effect) and decreased albedo (warming effect) to produce opposite results; more indirect feedback comes from changes in cloud cover (Wang et al., 2009), atmospheric circulation and water circulation. The specific effects of vegetation changes on land surface temperature in different regions are the results of various feedback pathways.

    4.2 Vegetation feedback to the surface heat balance

    Vegetation is a regulator of climate change that can dramatically mitigate factors that change climate. Vegetation affects local climates by altering the surface energy budget and water cycle, more changes push climate factors change in vegetation’s favor. Zeng et al.(2017) used model data to analyze the feedback of global vegetation activities on temperature over the past 30 years, and obtained the feedback strength of vegetation on temperature through various energy paths. However, due to the diversity of vegetation changes, the feedback of vegetation to temperature is not significant in some areas (Zeng et al., 2017).

    Vegetation cover is affected by precipitation fluctuations, and changes in vegetation cover affect the surface heat balance and the allocation of available energy from sensible heat and latent heat (Matsui et al., 2005; Zaitchik et al., 2005; Meng et al., 2014). In one study, the enhancement of vegetation activity produced a large amount of evapotranspiration, which had the effect of cooling land surfaces (Jeong et al., 2009). This study also found that increased vegetation activity (e.g., increased plant growth) may slow warming by absorbing more carbon and reducing the rate of increase in CO2 concentrations. Generally, feedback from vegetation amplifies or restrains climate changes made by nature or humans (Jeong et al., 2012). Changes in vegetation albedo, radiation and evapotranspiration intensity play an important role in deciding its comprehensive performance on climate (Collatz et al., 2000; Chapin et al., 2000; Field et al., 2007; Zhou et al., 2007; Pearson et al., 2013). Land surface cooling may be due to excess heat being dissipated by transpiration and thermal advection (Rotenberg and Yakir, 2010). But the effects of biophysics on heat flow are complex and depend on the climatic background (Pitman et al., 2011). The regulating effect and feedback mechanisms of vegetation on climate are also different in different regions and under different climatic backgrounds.

    4.3 The characteristics of vegetation feedback on surface energy balance in sensitive areas

    The feedback of vegetation on climate was more pronounced and noticeable in sensitive areas. When vegetation replaces a snow-covered or desert surface, albedo decreases, and the increase in the absorption of solar radiation leads to higher surface temperatures (Bonan et al., 1992; Foley et al., 1994; Chapin et al., 2005). This increased temperature is more suitable for the growth of vegetation. Some researchers have used an asynchronously coupled regional climate-vegetation model (Alo and Wang, 2010) to estimate future climate changes with increased carbon dioxide (with or without vegetation feedback), confirming the importance of vegetation feedback for climate change.

    Climate models that do not take into account vegetation feedback are problematic for regions like the Tibetan Plateau where hydrological environments are sensitive to climate change or climate is sensitive to vegetation change. Slowdowns of warming are largely due to increasing evapotranspiration caused by more vegetation, the effect growing seasons for vegetation that begin earlier have on spring temperatures, and the cooling effect enhanced by the interaction between vegetation and evapotranspiration (Jeong et al., 2009). In some regions where large areas of land have been altered by human design, the feedback of vegetation activities to climate suggests that human activities can interfere in the management of climate change.

    5 Conclusions

    In summary, daytime LST noticeably increased across the northern Tibetan Plateau, except in the southwestern area. Nighttime LST changes were different, with cooling in the eastern region (0.1 ℃ per decade), and warming in the western region (0.2 ℃ per decade). In general, the daytime and nighttime LST trends showed an asymmetric diurnal variation, with a larger magnitude of daytime warming than nighttime cooling. The spatial distribution pattern of LST induced by albedo and ET was similar, and was characterized by a gradual decrease moving from the center of the plateau to the peripheries. The absorption of shortwave radiation led to the maximum decrease in LST (-0.5 - -0.4 ℃ per decade) occurring in the central region. The minimum decrease (-0.2 - -0.1 ℃ per decade) occurred in the eastern region. A decrease in latent heat led to an increase in the LST maximum (【-逻*辑*与-】gt;1 ℃ per decade) in the central region. The eastern region increased at a rate of 0.2-0.5 ℃ per decade, while the minimum increase (0-0.1 ℃ per decade) occurred in the northwestern region. LST in the southwestern area decreased (-0.2 - -0.1 ℃ per decade). The relatively higher increasing LST by decreasing ET was on the eastern region. The decrease in energy loss caused by the decrease in ET exceeded the decrease in energy input caused by the increase in albedo.

    References

    [1] Alo CA, Wang GL. Role of dynamic vegetation in regional climate predictions over western Africa. Climate Dynamics, 35, 907-922(2010).

    [2] Bonan GB, PollardD, Thompson SL. Effects of boreal forest vegetation on global climate. Nature, 359, 716-718(1992).

    [3] BonfilsC, LobellD. Empirical evidence for a recent slowdown in irrigation-induced cooling. Proceedings of the National Academy of Sciences of the USA, 104, 13582-13587(2007).

    [4] BounouaL, DeFriesR, Collatz GJ et al. Effects of land cover conversion on surface climate. Climatic Change, 52, 29-64(2002).

    [5] CaiH, YangX, XuX. Human-induced grassland degradation/ restoration in the central Tibetan Plateau: The effects of ecological protection and restoration projects. Ecological Engineering, 83, 112-119(2015).

    [6] Chapin FS, EugsterW, McFadden JP et al. Summer differences among Arctic ecosystems in regional climate forcing. Journal of Climate, 13, 2002-2010(2000).

    [7] Chapin FS, SturmM, Serreze MC et al. Role of land-surface changes in Arctic summer warming. Science, 310, 657-660(2005).

    [8] Collatz GJ, BounouaL, Los SO et al. A mechanism for the influence of vegetation on the response of the diurnal temperature range to changing climate. Geophysical Research Letters, 27, 3381-3384(2000).

    [9] Cox PM, Betts RA, Jones CD et al. Acceleration of global warming due to carbon-cycle feedbacks in a coupled climate model. Nature, 408, 184-187(2000).

    [10] Diffenbaugh NS. Influence of modern land cover on the climate of the United States. Climate Dynamics, 33, 945-958(2009).

    [11] Feddema JJ, Oleson KW, Bonan GB et al. The importance of land-cover change in simulating future climates. Science, 310, 1674-1678(2005).

    [12] Field CB, Lobell DB, Peters HA et al. Feedbacks of terrestrial ecosystems to climate change. Annual Review of Environment and Resources, 32, 1-29(2007).

    [13] Foley JA, Kutzbach JE, Coe MT et al. Feedbacks between climate and boreal forests during the Holocene epoch. Nature, 371, 52-54(1994).

    [14] FuG, WuJ. Validation of MODIS Collection 6 FPAR/LAI in the alpine grassland of the northern Tibetan Plateau. Remote Sensing Letters, 8, 831-838(2017).

    [15] Jeong SJ, Ho CH, Jeong JH. Increase in vegetation greenness and decrease in springtime warming over east Asia. Geophysical Research Letters, 36, L02710(2009).

    [16] Jeong JH, Kug JS, Kim BM et al. Greening in the circumpolar high-latitude may amplify warming in the growing season. Climate Dynamics, 38, 1421-1431(2012).

    [17] KalaJ, DeckerM, Exbrayat JF et al. Influence of leaf area index prescriptions on simulations of heat, moisture, and carbon fluxes. Journal of Hydrometeorology, 15, 489-503(2014).

    [18] KalnayE, CaiM. Impact of urbanization and land-use change on climate. Nature, 423, 528-531(2003).

    [19] King GA, Neilson RP. The transient-response of vegetation to climate change — A potential source of CO2 to the atmosphere. Water Air and Soil Pollution, 64, 365-383(1992).

    [20] KucharskiF, ZengN, KalnayE. A further assessment of vegetation feedback on decadal Sahel rainfall variability. Climate Dynamics, 40, 1453-1466(2013).

    [21] Kueppers LM, Snyder MA, Sloan LC. Irrigation cooling effect: Regional climate forcing by land-use change. Geophysical Research Letters, 34, L03703(2007).

    [22] LobellD, BalaG, MirinA et al. Regional fifferences in the influence of irrigation on climate. Journal of Climate, 22, 2248-2255(2009).

    [23] MalhiY, Roberts JT, Betts RA et al. Climate change, deforestation, and the fate of the Amazon. Science, 319, 169-172(2008).

    [24] MatsuiT, LakshmiV, Small EE. The effects of satellite-derived vegetation cover variability on simulated land-atmosphere interactions in the NAMS. Journal of Climate, 18, 21-40(2005).

    [25] MauritsenT, Graversen RG, KlockeD et al. Climate feedback efficiency and synergy. Climate Dynamics, 41, 2539-2554(2013).

    [26] Meng XH, Evans JP, McCabe MF. The impact of observed vegetation changes on land-atmosphere feedbacks during drought. Journal of Hydrometeorology, 15, 759-776(2014).

    [27] Pearson RG, Phillips SJ, Loranty MM et al. Shifts in Arctic vegetation and associated feedbacks under climate change. Nature Climate Change, 3, 673-677(2013).

    [28] Pielke RA, AdegokeJ, Beltran-PrzekuratA et al. An overview of regional land-use and land-cover impacts on rainfall. Tellus Series B-Chemical and Physical Meteorology, 59, 587-601(2007).

    [29] Pielke RA, MarlandG, Betts RA et al. The influence of land-use change and landscape dynamics on the climate system: Relevance to climate-change policy beyond the radiative effect of greenhouse gases. Philosophical Transactions of the Royal Society of London Series a-Mathematical Physical and Engineering Sciences, 360, 1705-1719(2002).

    [30] Pitman AJ, Avila FB, AbramowitzG et al. Importance of background climate in determining impact of land-cover change on regional climate. Nature Climate Change, 1, 472-475(2011).

    [31] Pitman AJ, Narisma GT. The role of land surface processes in regional climate change: A case study of future land cover change over south western Australia. Meteorology and Atmospheric Physics, 89, 235-249(2005).

    [32] RotenbergE, YakirD. Contribution of semi-arid forests to the climate system. Science, 327, 451-454(2010).

    [33] Seneviratne SI, LuthiD, LitschiM et al. Land-atmosphere coupling and climate change in Europe. Nature, 443, 205-209(2006).

    [34] ShuklaJ, NobreC, SellersP. Amazon deforestation and climate change. Science, 247, 1322-1325(1990).

    [35] StowD, DaeschnerS, HopeA et al. Variability of the seasonally integrated normalized difference vegetation index across the north slope of Alaska in the 1990s. International Journal of Remote Sensing, 24, 1111-1117(2003).

    [36] Wang JF, Chagnon F JF, Williams ER et al. Impact of deforestation in the Amazon basin on cloud climatology. Proceedings of the National Academy of Sciences of the USA, 106, 3670-3674(2009).

    [37] WuJ, FengY, ZhangX et al. Grazing exclusion by fencing non-linearly restored the degraded alpine grasslands on the Tibetan Plateau. Scientific Reports, 7, L15202(2017).

    [38] WuJ, FuG. Modelling aboveground biomass using MODIS FPAR/LAI data in alpine grasslands of the Northern Tibetan Plateau. Remote Sensing Letters, 9, 150-159(2018).

    [39] YangK, WuH, QinJ et al. Recent climate changes over the Tibetan Plateau and their impacts on energy and water cycle: A review. Global and Planetary Change, 112, 79-91(2014).

    [40] Zaitchik BF, EvansJ, Smith RB. MODIS-derived boundary conditions for a mesoscale climate model: Application to irrigated agriculture in the euphrates basin. Monthly Weather Review, 133, 1727-1743(2005).

    [41] ZengZ, PiaoS, Li L ZX et al. Climate mitigation from vegetation biophysical feedbacks during the past three decades. Nature Climate Change, 7, 432-439(2017).

    [42] Zhou LM, Dickinson RE, Tian YH et al. Impact of vegetation removal and soil aridation on diurnal temperature range in a semiarid region: Application to the Sahel. Proceedings of the National Academy of Sciences of the USA, 104, 17937-17942(2007).

    Yunfei FENG, Yingwei DI, Jing ZHANG, Xianzhou ZHANG, Peili SHI, Ben Niu. Impact of Grazing Exclusion on the Surface Heat Balance in North Tibet[J]. Journal of Resources and Ecology, 2020, 11(3): 283
    Download Citation