
Jiangshuoxue Han, Yang Liu, Zejiang Deng, Gehui Xie, Daping Luo, Chenglin Gu, Lian Zhou, Wenxue Li. Optimizing noise characteristics of mode-locked Yb-doped fiber laser using gain-induced RIN-transfer dynamics[J]. High Power Laser Science and Engineering, 2021, 9(3): 03000e36
- High Power Laser Science and Engineering
- Vol. 9, Issue 3, 03000e36 (2021)
Abstract
1. Introduction
Mode-locked lasers that deliver pulse trains with ultralow phase noise repetition rates are potential low timing jitter sources for many applications, such as optical clock distribution[1], high-speed optical data transmission[2], high-resolution photonics sampling and analog-to-digital converters[3], and synchronization of pump–probe laser systems[4]. Currently, all of these applications impose stringent requirements on the low timing jitter and phase noise performances. Following theoretical predictions, ultrafast mode-locked lasers can generate extremely low phase noise in quantum noise limited[5,6]. The abovementioned studies involve the use of analytical models for timing jitter and phase noise based on soliton perturbation theory; furthermore, the physical mechanisms of different laser parameters as well as the suggestions for further optimization are provided.
Based on these theories, various studies have been conducted regarding noise origin and noise suppression methods. Noise sources from intracavity parameters and extra-cavity perturbation can affect the performance of mode-locked lasers. Amplified spontaneous emission (ASE) noise has been proven to be a fundamental limitation in phase noise; it is a direct noise source and can be coupled to phase noise via cavity dispersion and pulse chirp[7]. Other noise sources include intensity noise and acoustic noise. Acoustic noise originating from environmental perturbations such as temperature and vibrations results in a series of noise peaks in the range of 100 Hz to several kilohertz[8,9]. The fluctuation of pump laser causes intensity noise to increase owing to laser dynamics and gain response time. The phase change in the gain medium, known as the Kramers– Kroning relationship, and the self-steepening effect provide other coupling mechanisms for intensity noise[10]. Phase changes combined with a finite gain bandwidth induce gain fluctuations, resulting in an inversion-level dependent group delay and, hence, coupling to the phase noise spectrum[11]. Meanwhile, the self-steepening associated with the gain bandwidth and third-order dispersion affects the repetition rate and carrier–envelope offset frequency[12].
In the past few decades, it has been demonstrated that using pulse-shaping[13], dispersion management[14], intra-cavity filtering[15], and nonlinear balancing[16] can reduce phase noise and timing jitter. Furthermore, coupling mechanisms and nonlinear conversion from the relative intensity noise (RIN) of a pump laser to the RIN and phase noise of a mode-locked laser and an amplifier have been discussed and measured[17]. The limitation of the gain response time serves as a low-pass filter for the RIN of the pump laser. Moreover, theoretical models predict that the saturation of an amplifier is crucial for RIN-transfer dynamics. Several parameters, such as the mode field area, absorption, upper state lifetime, and stimulated emission cross-section of the gain fiber, determine the amplifier’s gain saturation[18,19]. These models, which help analyze the noise origin, assume the gain as a constant. However, different gain media with different parameters are used in real mode-locked lasers. Therefore, it is interesting to investigate the effect of the gain parameters on the RIN-transfer dynamics and the phase-noise performance in mode-locked lasers. The findings may provide an optimization guideline for selecting a gain medium to reduce the timing jitter and phase noise. Although the RIN-transfer dynamics is a complex problem, including the intricate interplay of the strong nonlinear, dispersive, and dissipating pulse shaping effects, the transfer function is measured in our work to simplify the analysis process to characterize RIN-transfer dynamics. It describes the relationship between pump modulation and the induced modulation on the output of the mode-locked laser[17]. We can investigate the effect of the gain parameters on the RIN-transfer dynamics by analyzing the change of transfer function.
Sign up for High Power Laser Science and Engineering TOC. Get the latest issue of High Power Laser Science and Engineering delivered right to you!Sign up now
Gain parameters dependent on RIN-transfer dynamics and phase noise performances in a mode-locked Yb-doped fiber laser are investigated experimentally in this study. We characterize the noise performance of a mode-locked laser using the noise transfer function and phase noise power spectral density (PSD). It was discovered that the phase noise and response bandwidth are determined by the absorption coefficient when the total absorption and other parameters are fixed. To the best of the authors’ knowledge, this is the first study to investigate the gain-related evolution of the RIN-transfer dynamics and phase noise PSD using a mode-locked Yb-doped fiber laser. Furthermore, we demonstrate that the RIN-transfer function is dependent on the variational net-cavity dispersion. Subsequently, we derive a guideline for optimizing mode-locked fiber laser design to achieve low phase noise and timing jitter. We believe that the coupling process from pump noise to the output phase noise can be reduced and the phase noise can be suppressed by using the gain fiber with lower dopant concentration. At the same time, keeping the oscillator near the zero-dispersion point can also reduce the phase noise.
2. Experimental setup
We conducted experiments on a custom developed NPR mode-locked Yb-doped fiber oscillator with a pair of gratings in the cavity for dispersion compensation; the experimental setup is shown in Figure 1. The total cavity length was fixed at 4 m, resulting in a fundamental repetition rate of 50 MHz. After adjusting the wave plates and pump power, we achieved stable mode-locking. A polarizing beam splitter (PBS) was placed in the cavity, and it extracted the linear polarization pulses for noise and transfer function measurements. We used a two-channel frequency response analyzer (FRA, Moku:Lab), which offered a modulation frequency fm from 1 Hz to 120 MHz, to measure the transform function. This FRA supplied a drive signal to the pump laser diode of the mode-locked laser. This signal yielded an extremely weak (~0.1%) amplitude modulation on the pump laser via the modulated driver current, thereby allowing the pump laser’s RIN to be controlled. It has been proven that a direct correlation exists between the noise properties of a mode-locked laser’s pump source and pump power[20,21]. We operated the laser diode at a fixed driver current and condition to remove the effect of driver-current-related pump noise. We used the variable optical attenuator (VOA) to change the actual pump power following a fiber coupler. A 1% pump power extracted from this coupler was detected using a photodiode to generate a reference signal. This signal, which was proportional to the modulation index, was sent to Ch1 of the FRA. Another photodiode is used to detect modulated output pulses and deliver the signal to Ch2, as the mode-locked laser’s amplitude modulation index. The ratio between the signals measured by Ch2 and Ch1 over the complete modulation frequency range yielded the complex transfer function by the FRA. Furthermore, it can analyze the transfer function and calibrate data. Subsequently, the amplitude and phase information were obtained. In addition to the phase and amplitude noise measurements, we determined the single-side-band (SSB) PSD of the fundamental repetition rate using a signal source analyzer (FSWP8, R&S).
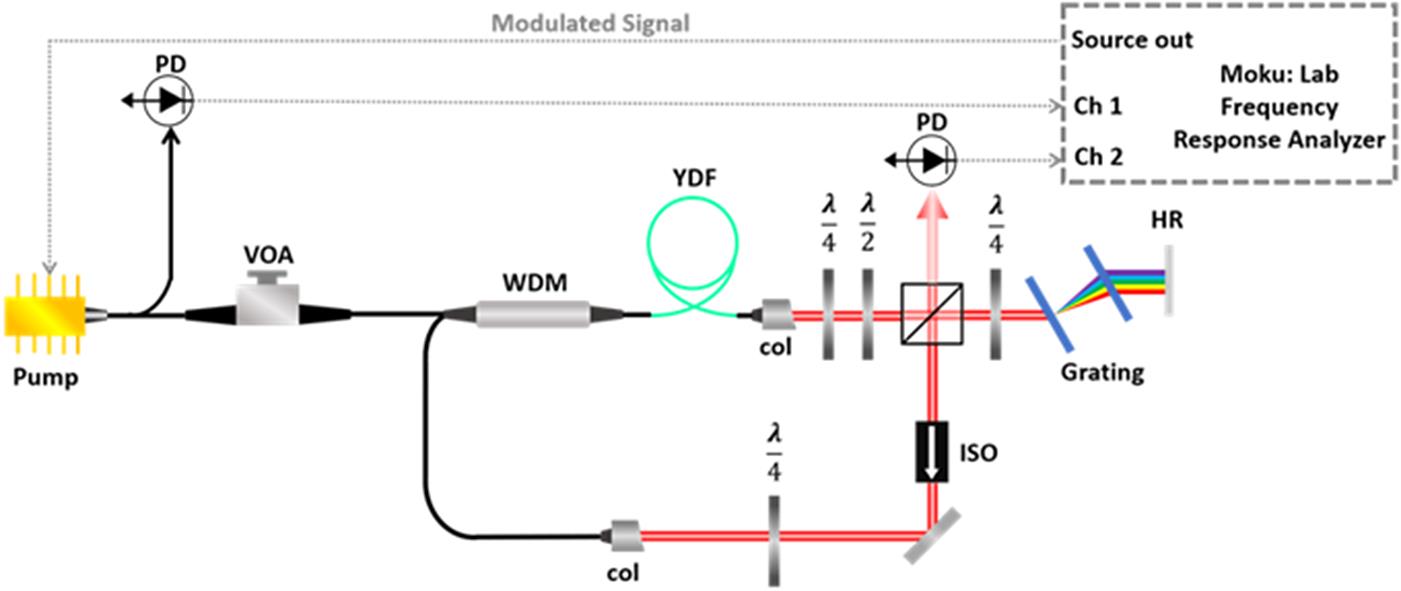
Figure 1.Experimental setup for noise transfer function measurement of NPR mode-locked Yb-doped fiber laser. VOA, variable optical attenuator; WDM, wavelength-division multiplexer; YDF, Yb-doped fiber; col, collimator; PBS, polarizing beam splitter; HR, high reflection mirror; ISO, optical isolator; PD, photodiode.
3. Results and discussion
In the first experiment, we specifically focused on the gain-related noise transform function and noise characteristics. First, we prepared four types of Yb-doped fibers with different dopant concentrations as the gain medium. The fibers were Yb406 (Coractive, absorption: 1800 dB/m @ 976 nm), Yb1200-4/125 (Nlight, absorption: 1200 dB/m @ 976 nm), Yb401 (Coractive, absorption: 500 dB/m @ 976 nm), and YDF350 (OFS, absorption: 350 dB/m @ 976 nm). The critical part of this experiment was to maintain the same mode-locking state and intracavity gain. A straightforward approach to ensure the same intracavity gain was to use different gain fiber lengths to achieve the same overall absorption. To maintain the same absorption in the cavity, we estimated the overall absorption by multiplying the fiber length and core absorption per unit.
Moreover, the net cavity dispersion determined the mode-locking operating states resulting in the different noise characterizations[22]. To eliminate the effect of the net cavity dispersion, based on the gain fiber length variation, the length of the passive fiber was varied to maintain the cavity length at 4 m; furthermore, we adjusted the outpower to a certain value by tuning the VOA. By adjusting the grating separation, the net cavity dispersion was controlled to approximately zero. When we changed the gain fibers, the grating separation was fixed. The laser power injected into the photodiode was set to 0.1 mW to ensure that the photodiode was operating in the linear regime.
Figure 2 shows the measured transfer functions using different types of Yb-doped fibers in the mode-locked laser, including the magnitude and the phase versus modulated frequencies from 1 Hz to 1 MHz. As shown in Figure 2(a), it is evident that the magnitude characteristics were highly dependent on the fiber dopant concentration. Above 10 kHz modulated frequency, the curves exhibited different roll-off points. The laser diode driver’s response frequency bandwidth was the main limitation for the modulated frequency range, and it ranged from 1 Hz to 400 kHz. In the high modulated frequency region, the upper laser level’s limited lifetime damped the fast modulations below 150 kHz. The transfer functions for different gain fibers exhibited different amplitudes at low frequencies and cut-off frequencies (–3 dB bandwidth).
![]()
Figure 2.Experimentally measured transfer function (a) amplitude and (b) phase of NPR mode-locked Yb-doped fiber laser using different types of Yb-doped fibers and the same dispersion condition. The four lines represent four different types of fibers.
Moreover, the amplitude attenuation increased as the dopant concentration decreased. In the low-frequency region, the transfer function curves exhibited a flat gain. The response function curve for Yb406, which had the highest dopant concentration, exhibited the characteristic –10 dB/decade roll-off of a single-pole filter at 140 kHz. Simultaneously, a higher dopant concentration resulted in a higher cut-off frequency than the other curves. YD350, whose absorption was the lowest, exhibited the lowest conversion amplitude compared with the other curves as well as the narrowest bandwidth. Independent of the modulation frequency, YD350 was approximately 20 dB lower than Yb406 in amplitude. Its inflection point for the transfer function was 11 kHz, which was much lower than that of Yb406; the difference was almost 13 times. It can be intuitively understood that with the higher dopant concentration of the gain fiber, the amplitude increased and the cut-off frequency was broader. As shown in Figure 2(b), the transfer function phase increased gradually from 0° to 180° as the modulated frequency increased. Similar phenomena were observed for different gain fibers in the low-frequency region. The gain fiber, which had a high dopant concentration, had a low phase shift at higher frequencies. In other words, with high dopant concentration, the corner frequency increased (defined as the frequency point with a phase shift of 90°). As the dopant concentration increased, the corner frequency improved from 17 to 42 kHz. It is noteworthy that the full modulated frequency (phase shift to –180°) exhibited the same behavior. The transfer function represents the conversion process of noise in an oscillator. The transfer function which had a low amplitude, resulted in good noise suppression capability. These results suggest that an oscillator using a gain fiber with a higher dopant concentration will accumulate more phase noise.
Next, we present the SSB phase noise PSD of the oscillators using different gain fibers in Figure 3(a), and the corresponding integrated phase noise is shown in Figure 3(b). For the SSB noise PSD measurements, the average power injected into the fiber pigtail PD was adjusted to 0.1 mW. The measurement noise floor in phase noise measurement was limited by the shot noise of photodiode. We can obtain the shot noise caused by the photodiode as –163 dBc/Hz and the minimum phase noise we measured as –162.4 dBc/Hz. For the offset frequency below 10 Hz, the all-phase noise PSD curves rolled off by more than 45 dBc/decade and exhibited a 1/f2 slope characteristic, indicating random walk noise performance from environmental perturbations. However, the oscillator using Yb406 accumulated more noise in this region. In the frequency region from 10 Hz to 10 kHz, the curves exhibited a similar behavior with a slower roll-off, as it was affected by the technical 1/f noise from the dispersion, white amplitude noise, and cavity loss. The phase noise PSD presented consistent characteristics owing to the use of the same pump laser diode and operation at a fixed net-cavity dispersion. It is noteworthy that inflection points for different curves from 1 to 10 kHz depended on the dopant concentration. With a higher dopant concentration, more phase noise accumulated in this region and lower corner frequency was obtained. In the following high-frequency region (10 kHz to 10 MHz), the noise characteristics were determined by the shot noise and ASE. The measured results indicate that the ASE-induced noise was significantly associated with the dopant concentration.
![]()
Figure 3.(a) Phase noise measurements of laser system using different types of Yb-doped fibers based on the same dispersion condition. Four lines represent four different types of fiber. (b) Corresponding integrated phase noise.
The case where YDF350 was used yielded less phase noise compared with cases involving other highly doped fibers. This can be inferred intuitively from the integration results. Table 1 lists the specific noise characteristics after integrating each gain fiber from 1 Hz to 10 MHz. In the region from 100 kHz to 10 MHz shown in Figure 3(b), the phase noise of Yb406 accumulated rapidly and exhibited a maximum integral value at 100 kHz. In contrast, by substituting YDF350 with Yb406, the accumulated phase noise reduced from 0.57 to 0.15 mrad after integrating from 10 MHz to 100 kHz. In the intermediate frequency range from 100 Hz to 100 kHz, the integrated phase noise changed slightly. In the low-frequency region, the integrated phase noise of Yb406 continued to increase rapidly and then maintained a maximum value. Table 1 summarizes the typical gain fiber parameters, cut-off frequency, corner frequency in the phase domain, and integrated phase noise for each mode-locked laser.
| Integrated phase | |||||
|---|---|---|---|---|---|
| Mode field | Cut-off | Corner | noise | ||
| Absorption | diameter | frequency | frequency | (1 Hz to 10 MHz) | |
| Fiber | @976 nm (dB/m) | @1060 nm (nm) | (kHz) | (kHz) | (mrad) |
| Yb 406 | 2400 | 5 ± 1 | 140 | 42.7 | 1481.7 |
| Yb1200-4/125 | 1200 | 4.4 ± 0.8 | 50 | 33.1 | 81.6 |
| Yb401 | 400 | 6 ± 1 | 14 | 20.6 | 47.4 |
| YD350 | 350 | 3.6 | 11 | 17.0 | 36.4 |
Table 1. Typical fiber specifications and their transfer function features.
In the second experiment, we focused on the dispersion-related noise transform function and noise characteristics. Hence, we changed the net cavity dispersion by tuning the grating separation. We selected five net-cavity dispersions: two positive dispersion points, two negative dispersion points, and a zero-net-cavity dispersion point from –12 ps2 to +12 ps2. Figure 4 shows that the output optical spectrum varied for the five dispersion points. When the laser operated at near-zero dispersion, the laser yielded a stretching pulse. The nonlinear effect in the mode-locking process was strong and the spectrum was modulated and broadened. As shown in Figure 4, the zero-net-cavity dispersion point exhibited the broadest spectra. When the laser operated in the normal dispersion region, the laser yielded a dissipative soliton pulse. The spectral edge was steep, and the width was narrowed. The spectrum narrowed with the increase in dispersion. When the laser dispersed anomalously, it yielded a soliton mode-locked pulse. The net negative dispersion in the cavity decreased the self-phase modulation of the pulse in the cavity, weakened the spectral modulation, and narrowed the output pulse spectrum. Furthermore, Kelly sidebands were observed on both sides of the output spectrum. At this part of the experiment, we were able to guarantee that only the net cavity dispersion changed. We used YD350 for our experiment owing to its best noise characteristics. Similar to the first part of the experiment, we maintained the cavity length and output power at 4 m and 60 mW, respectively.
![]()
Figure 4.Measured optical spectrum at different net cavity dispersion using YD350.
Figure 5 shows the measured transfer functions in five different net cavity dispersions in the mode-locked laser, including the amplitude and the phase versus the modulated frequencies from 1 Hz to 1 MHz. As shown in Figure 2(a), the magnitude characteristics were related to the net-cavity dispersion of the mode-locked laser. The transfer functions of different cavity dispersions had different magnitudes at the low frequency and cut-off frequencies. However, this difference was inconspicuous. The transfer function curve of the oscillator with a –0.12 ps2 net-cavity dispersion had the highest gain in the low-frequency region and widest bandwidth, indicating that the soliton pulse was sensitive to pump-induced noise. The transfer function curve of the near-zero net-cavity dispersion that resulted in stretched pulse generation had the lowest transfer function amplitude and narrowest bandwidth. However, their differences were much lower than in the first part experiment. The difference between magnitudes was only 8 dB, and the difference in the cut-off frequency was only 2.6 times. Figure 5(b) shows similar phenomena for different net-cavity dispersions in the low-frequency region. The mode-locked laser in the near-zero net-cavity dispersion exhibited the highest phase shift at the same frequency. In other words, the zero-net-cavity dispersion had the lowest corner frequency, i.e., twice that of the soliton pulse. As mentioned previously, a transfer function with a lower amplitude resulted in better noise suppression capability. It is clear that the mode-locked laser in the near-zero net-cavity dispersion exhibited the best noise characteristics. These experimental validations have been demonstrated previously[16]. In this study, we first used a transfer function to distinguish the dispersion-induced response frequency. Different net-cavity dispersions are vital to the transfer function and noise characteristics. The corner frequency in the amplitude and phase indicated that minimizing the net cavity dispersion was conducive to reducing conversion between the pump-induced and oscillator's phase noise. However, the effect was significantly less prominent than that caused by changing the gain fiber.
![]()
Figure 5.Experimentally measured transfer function (a) amplitude and (b) phase of the laser system using YD350 and by changing dispersion condition. The five lines represent five different dispersion conditions.
Next, the SSB phase noise PSD of the oscillators in different net-cavity dispersions was measured, as shown in Figure 6(a). Similarly, we were able to fit all the phase noise PSD curves as the sum of the PSD law, and their corner frequencies were the same. For the offset frequency ranges of less than 10 Hz, 10 Hz–10 kHz, and 10 kHz–10 MHz (high-frequency region), all the phase-noise PSD curves indicated 1/f2, 1/f, and 1/f0 slope characteristics, respectively. For the offset frequency below 10 Hz, which indicated the random walk noise nature from environmental perturbations, the results of all curves were similar. However, the oscillator in 0.12 ps2 accumulated slightly more noise in this region. Therefore, a dissipative soliton with a broader pulse duration can couple more pump-induced noise to the phase noise. For the offset frequency from 10 Hz to 10 kHz, where the shot noise and ASE determined the noise characteristics, all the noises were similar because of the same gain fiber used. For the offset frequency from 10 kHz to 10 MHz, each curve indicated a different behavior. The oscillator near-zero net-cavity dispersion demonstrated the lowest phase noise. This was primarily because different net-cavity dispersions resulted in different white amplitude noises and cavity losses. Figure 6(b) shows the corresponding integrated phase noise, further illustrating the process. Over the entire frequency range, the oscillator near-zero net-cavity dispersion accumulated the lowest phase noise and demonstrated the best noise characteristic. This finding confirmed the results obtained from the transfer function. Table 2 lists the specific characteristics, including the low-frequency gain, cut-off frequency, and 90° phase shift frequency, of transfer functions with different net-cavity dispersions.
![]()
Figure 6.(a) Phase noise measurements of laser system using YD350 and by changing dispersion condition. Five lines represent five different dispersion conditions. (b) Corresponding integrated phase noise.
| Net cavity | Low-frequency | Cut-off | Corner | Integrated phase noise |
|---|---|---|---|---|
| dispersion (ps2) | gain (dB) | frequency (kHz) | frequency (kHz) | (1 Hz to 10 MHz) (mrad) |
| 0.00 | –43.1 | 15.8 | 29.2 | 29.9 |
| 0.06 | –41.7 | 21.7 | 33.1 | 36.4 |
| 0.12 | –39.6 | 29.1 | 35.3 | 42.1 |
| –0.06 | –49.4 | 32.0 | 38.0 | 55.1 |
| –0.12 | –35.4 | 40.0 | 49.9 | 94.9 |
Table 2. Transfer function features of different cavity dispersions.
4. Results and discussion
In summary, we have experimentally investigated the effects of the dopant concentration of a gain fiber and net cavity dispersion on oscillator phase noise characteristics. First, we measured gain-dependent transfer functions using four different types of Yb-doped fibers in the same cavity. The results showed that the characteristic parameters of noise conversion, such as corner frequency, roll-off slope, and amplitude, depended on the dopant concentration. The corresponding phase-noise PSD of the oscillators confirmed this result. Moreover, we demonstrated that the phase noise of an oscillator using a gain fiber with a higher dopant concentration accumulated more phase noise. Subsequently, we demonstrated that the RIN-transfer function was dependent on the variational net cavity dispersion. The measured results complemented the findings of previous studies regarding timing jitter and phase noise reductions via dispersion management. To optimizing mode-locked fiber laser design to achieve low phase noise and timing jitter, low dopant concentration fibers can be used to reduce the coupling process from pump noise to the output phase noise and suppress output phase noise. At the same time, keeping the oscillator near the zero-dispersion point can also reduce the phase noise. We believe that our study will be beneficial to the optimization of mode-locked fiber laser design for suppressing phase noise and timing jitter.
References
[1] P. J. Delfyett, D. H. Hartman, S. Z. Ahmad. J. Lightwave Technol, 9, 1646(1991).
[2] V. W. S. Chan, K. L. Hall, E. Modiano, K. A. Rauschenbach. J. Lightwave Technol, 16, 2146(1998).
[3] G. E. Villanueva, M. Ferri, P. Perez-Millan. IEEE J. Quantum Electron, 48, 1443(2012).
[4] M. Walbran, A. Gliserin, K. Jung, J. Kim, P. Baum. Phys. Rev. Appl, 4(2015).
[5] S. Namiki, H. A. Haus. IEEE J. Quantum Electron, 33, 649(1997).
[6] N. R. Newbury, W. C. Swann. J. Opt. Soc. Am. B, 24, 1756(2007).
[7] J. P. Gordon, L. F. Mollenauer. Opt. Lett, 15, 1351(1990).
[8] R. Paschotta, A. Schlatter, S. Zeller, H. Telle, U. Keller. Appl. Phys. B, 82, 265(2006).
[9] C. Wan, T. R. Schibli, P. Li, C. Bevilacqua, A. Ruehl, I. Hartl. Opt. Lett, 42, 5266(2017).
[10] R. Paschotta. , Appl. Phys. B , ()., 79, 163(2004).
[11] H. A. Haus, A. Mecozzi. IEEE J. Quantum Electron, 29, 983(1993).
[12] N. R. Newbury, B. R. Washburn. IEEE J. Quantum Electron, 41, 1388(2005).
[13] B. Fang, N. Mielec, D. Savoie, M. Altorio, A. Landragin, R. Geiger. New J. Phys, 20(2018).
[14] T. F. Carruthers, I. N. Duling, M. Horowitz, C. R. Menyuk. Opt. Lett, 25, 153(2000).
[15] L. A. Jiang, M. E. Grein, E. P. Ippen, C. McNeilage, J. Searls, H. Yokoyama. Opt. Lett, 27, 49(2002).
[16] Z. Zhu, Y. Liu, D. Luo, C. Gu, L. Zhou, G. Xie, Z. Deng, W. Li. High Power Laser Sci. Eng., 8(2020).
[17] R. P. Scott, T. D. Mulder, K. A. Baker, B. H. Kolner. Opt. Express, 15, 9090(2007).
[18] K. R. Hansen, J. Lægsgaard. Opt. Express, 22, 11267(2014).
[19] C. Barnard, P. Myslinski, J. Chrostowski, M. Kavehrad. IEEE J. Quantum Electron, 30, 1817(1994).
[20] Y. Yamamoto, S. Machida, O. Nilsson. Phys. Rev. A, 34, 4025(1986).
[21] J. Kim, Y. Song. Adv. Opt. Photonics, 8, 465(2016).
[22] L. Nugent-Glandorf, T. A. Johnson, Y. Kobayashi, S. A. Diddams. Opt. Lett, 36, 1578(2011).

Set citation alerts for the article
Please enter your email address
© Copyright 2018-2021 | Chinese Laser Press. All Rights Reserved 沪ICP备15018463号-20