
Xin Zhao, Xinzhu Sang, Hui Li, Duo Chen, Yuanhang Li, Cheng Peng, Binbin Yan. Holographic visualization of volume data based on adjustable ray to optical-wave conversion[J]. Chinese Optics Letters, 2022, 20(1): 010501
- Chinese Optics Letters
- Vol. 20, Issue 1, 010501 (2022)
Abstract
1. Introduction
Among various three-dimension (3D) display techniques, computer-generated holography is an ideal and more flexible technology[
In this work, we propose a CGH generation method for volume data to flexibly display abundant information of the volumetric field without additional polygonal model transformation. The proposed method realizes optional holographic visualization of the interior and surface of objects using the adjustable ray to optical-wave conversion method. Ray-casting rendering and the optical-wave superimposed method are used in the holographic recording process. Moreover, our method is implemented on GPU in parallel to reduce the CGH generation time. The specific scheme is shown as follows.
2. Basic Principle
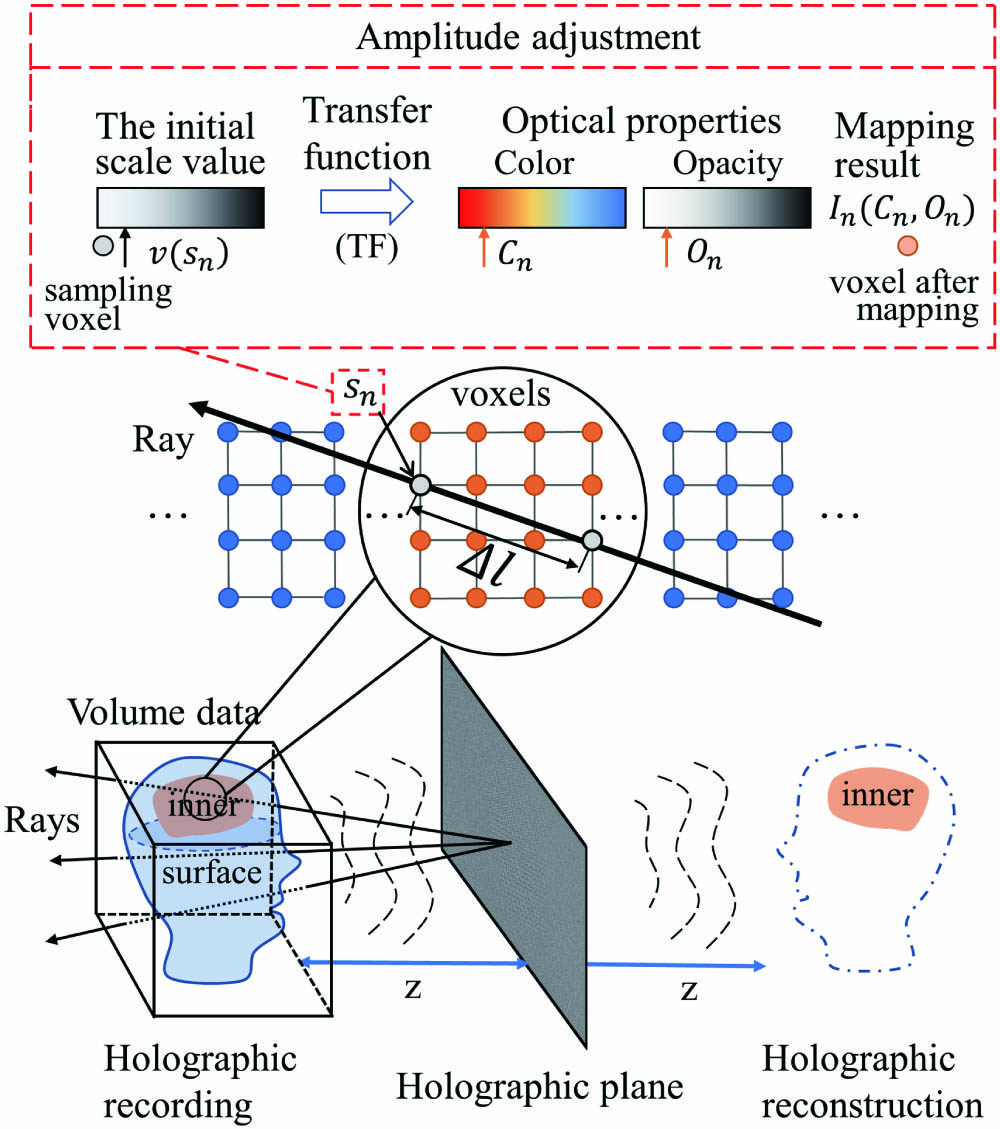
There are two stages in generating CGH of volume data: rays are cast from the hologram plane to collect and process efficient voxels in 3D virtual space, and then composited data acquired from the rays are directly converted into back propagating optical waves to be superimposed on the holographic plane. The adjustable ray to optical-wave conversion method is illustrated in Fig. 1. A bundle of rays is emitted from the center of the hologram element after determining the direction of each ray. Equal interval path sampling is carried out if the rays intersect with the volume data. Suppose the origin of the ray is , the normalized direction vector of the ray is , and the ray can be expressed by parametric function , , where represents the distance between the sampling point and the origin of the ray. If the ray enters the volume data at and exits from the volume data at , then the domain of is determined as . The coordinate of can be converted by , and the next sampling position is , where is the sampling interval. The sampling value can be derived by trilinear interpolation of eight voxel values adjacent to the position, as shown in Fig. 2(a).
Sign up for Chinese Optics Letters TOC. Get the latest issue of Chinese Optics Letters delivered right to you!Sign up now
![]()
Figure 1.Adjustable ray to optical-wave conversion to generate CGH of volume data.
![]()
Figure 2.(a) The process of sampling. (b) The process of adjustment.
The raw voxel value is a scalar value. Considering that objects of the same type have some similarity in scalar values, the scalar value of volume data can be used as a data feature for the classification basis of different regions of objects. When a scalar sample value is obtained, it is mapped to a group of four-dimensional values with optical properties (RGB color values and opacity) by transfer function, as shown in Fig. 2(b). The transfer function can be regarded as the control function of the object light wave. By adjusting the control function, the presentation or suppression of the information of the sample can be controlled to affect the overall complex amplitude of the virtual object. The mapping process is expressed as
After the mapping process, information composition is analyzed with the absorption-emission model[
The synthetic object point propagates light waves to the hologram plane in the form of spherical waves. Therefore, the complex amplitude distributions in the hologram plane are parallelly calculated by
3. Implementation
Figure 3 summarizes the whole process described above, and Fig. 4 is the light path setup. There is a beam splitter for changing the light path, a polarizer for converting the polarization state of laser beam, and a system with a filter for reducing low-frequency noise interference. A central processing unit (CPU) launches the GPU kernel after configuring parameters of the transfer function. GPU parallelly computes the value of hologram units using the information of each ray. If the scale and offset of the transfer function are changed, or there are interactive operations, the ray-casting process is restarted for re-calculating CGH. Lastly, the CGH data is loaded on the spatial light modulator (SLM) for holographic display.
![]()
Figure 3.Flow chart of the proposed method.
![]()
Figure 4.Optical reconstruction system.
The volume data is bound to texture memory of the GPU to achieve random and fast reading. We use CUDA-9.1, the parallel computing architecture of NVIDIA, to accelerate the CGH calculation process. The CPU and GPU are Intel Core i7-7700HQ and Nvidia GTX 1060. Intersection detection and early ray termination strategy are adopted to accelerate the ray-casting process. Intersection detection terminates the missing ray that does not hit the object in advance. Early ray termination strategy terminates the ray when the accumulated opacity reaches 1.0. By reducing meaningless operation, these strategies have a positive effect on acceleration. The time trend of the proposed method is shown in Fig. 5 (the size of input volume data: ). In the traditional polygon-based method in Ref. [20], it takes 23.9 s to generate CGHs for volume data with a GPU. In the traditional approximate volume rendering method in Ref. [21], it takes up to 3.6 h to generate CGHs for volume data. Our method only takes 0.34 s (the number of rays: , the size of hologram: ). The results of Fig. 5 show good time performance in CGH generation for volume data. Besides, the time will decrease when the number of rays or the size of CGH reduces, which indicates that our work can provide dynamic interactive holographic display.
![]()
Figure 5.Time trend of the proposed method; M and N represent the width and height of CGH, respectively.
The optical experiment in Fig. 6 verifies the 3D properties of reconstructions. It uses the industrial volume data [computed tomography (CT) scan of two cylinders of an engine block, size: ] as the data source. The hologram is placed at the origin of the axis, the coordinate of volume data was set between 34 cm and 42 cm, and the and coordinates of volume data are both set between and 1 cm. Changes in the clear and blur parts of the object can be perceived when the camera is focused on different positions. It illustrates that the proposed method can represent the continuous depth information effectively. Figure 7 presents reconstructed images at different view directions. In the conventional holographic display method of volume data based on MIP in Ref. [20], the reconstructed object is symmetrical when viewing from opposite directions. The information loss is due to the limitations of the method itself, since it only takes maximum values in the path of the rays. The proposed method shows more information of the object. Observers can perceive different reconstructed images in opposite directions.
![]()
Figure 6.Depth information experiment. (a) Reconstructed image focusing on the front. (b) Reconstructed image focusing on the back of the object.
![]()
Figure 7.Different view directions of the reconstructed object (lateral size of display: 2 cm × 2 cm).
To demonstrate the adjustable reconstructions of the proposed method, we used the medical volume data (rotational -arm X-ray scan of a human skull and a human foot, size: ) as the data source. By adjusting the transfer function, the reconstruction can display different content to meet different viewing requirements. Figure 8(a) shows the different regions of interest in the skull volume data under different transfer functions, and Fig. 8(b) shows different concerns on tissue and bone information of the foot. Both the surface and the interior information of an object are expressed. Especially, the relationship between different organizational structures is easier to be understood, and diverse information in objects can be optically reconstructed.
![]()
Figure 8.Adjustable reconstructed content (lateral size of display: 2 cm × 2 cm) of the same object. (a) Different concern regions in the human skull under different transfer functions TFskull1, TFskull2, and TFskull3. (b) Different concern regions in the human foot under different transfer functions TFfoot1, TFfoot2, and TFfoot3.
4. Conclusion
In summary, a CGH generation method for expressing adjustable reconstructed content of volume data is proposed. It composes optical properties along the viewing direction and directly accumulates the synthetic data into the propagation process of light waves. Different from traditional monotonous holographic reconstructions of the objects’ surfaces, the method reconstructs the interior of objects optionally. Besides, with the adjustable ray to optical-wave conversion, the proposed method can flexibly and directly calculate the complex amplitude of a 3D virtual scene instead of the conventional input of constant 2D color and depth image. The proposed method offers a whole procedure of adjustable hologram of volume data, which can dynamically reconstruct different regions of objects according to different observation requirements. It is expected to be combined with several fields such as medical and industrial fields to achieve more diverse applications in the future.
References
[1] P. Yeh, C. Gu. 3D displays: toward holographic video displays of 3D images. Chin. Opt. Lett., 11, 010901(2013).
[2] N. Kim, M. A. Alam, L. T. Bang, A. Phan, M. Piao, M. Erdenebat. Advances in the light field displays based on integral imaging and holographic techniques. Chin. Opt. Lett., 12, 60005(2014).
[3] D. Wang, Q. Wang, C. Shen, X. Zhou, C. Liu. Color holographic zoom system based on a liquid lens. Chin. Opt. Lett., 13, 072301(2015).
[4] X. Sui, Z. He, H. Zhang, L. Cao, D. Chu, G. Jin. Spatiotemporal double-phase hologram for complex-amplitude holographic displays. Chin. Opt. Lett., 18, 100901(2020).
[5] M. E. Lucente. Interactive computation of holograms using a look-up table. J. Electron. Imaging., 2, 28(1993).
[6] S. Jiao, Z. Zhuang, W. Zou. Fast computer generated hologram calculation with a mini look-up table incorporated with radial symmetric interpolation. Opt. Express., 25, 112(2017).
[7] T. Nishitsuji, T. Shimobaba, T. Kakue, N. Masuda, T. Ito. Fast calculation of computer-generated hologram using the circular symmetry of zone plates. Opt. Express., 20, 27496(2012).
[8] Y. Pan, X. Xu, S. Solanki, X. Liang, R. Tanjung, C. Tan, T. Chong. Fast CGH computation using S-LUT on GPU. Opt. Express., 17, 21(2009).
[9] P. W. M. Tsang, T. C. Poon, Y. M. Wu. Review of fast methods for point-based computer-generated holography [Invited]. Photon. Res., 6, 837(2018).
[10] X. Cao, M. Guan, L. Xia, X. Sang, Z. Chen. Highly efficient generation of holographic stereograms based on wavefront recording plane. Chin. Opt. Lett., 15, 120901(2017).
[11] H. Sannomiya, N. Takada, K. Suzuki, T. Sakaguchi, H. Nakayama, M. Oikawa, Y. Mori, T. Kakue, T. Shimobaba, T. Ito. Real-time spatiotemporal division multiplexing electroholography for 1,200,000 object points using multiple-graphics processing unit cluster. Chin. Opt. Lett., 18, 70901(2020).
[12] Y. Zhang, J. Liu, X. Li, A. Y. Wang. Fast processing method to generate gigabyte computer generated holography for three-dimensional dynamic holographic display. Chin. Opt. Lett., 14, 30901(2016).
[13] Y. Frauel, T. J. Naughton, O. Matoba, E. Tajahuerce, B. Javidi. Three-dimensional imaging and processing using computational holographic imaging. Proc. IEEE, 94, 636(2006).
[14] Z. Chen, X. Sang, Q. Lin, J. Li, X. Yu, X. Gao, B. Yan, C. Yu, W. Dou, A. L. Xiao. Acceleration for computer-generated hologram in head-mounted display with effective diffraction area recording method for eyes. Chin. Opt. Lett., 14, 80901(2016).
[15] S. Igarashi, T. Nakamura, M. Yamaguchi. Fast method of calculating a photorealistic hologram based on orthographic ray-wavefront conversion. Opt. Lett., 41, 1396(2016).
[16] R. H. Chen, T. D. Wilkinson. Computer generated hologram with geometric occlusion using GPU-accelerated depth buffer rasterization for three-dimensional display. Appl. Opt, 48, G21(2009).
[17] L. J. Rosenblum. Research issues in scientific visualization. IEEE Comput. Graph., 14, 61(1994).
[18] S. Napel, M. P. Marks, G. D. Rubin, M. D. Dake, C. H. McDonnell, S. M. Song, D. R. Enzmann, J. R. B. Jeffrey. CT angiography with spiral CT and maximum intensity projection. Radiology, 185, 607(1992).
[19] O. Kutter, R. Shams, N. Navab. Visualization and GPU-accelerated simulation of medical ultrasound from CT images. Comput. Meth. Prog. Bio., 94, 250(2009).
[20] Z. Lu, Y. Sakamoto. Holographic display methods for volume data: polygon-based and MIP-based methods. Appl. Opt., 57, A142(2018).
[21] Z. Lu, Y. Sakamoto. Holographic display method for volume data by volume rendering. Opt. Express., 27, 543(2019).
[22] M. Levoy. Display of surfaces from volume data. IEEE Comput. Graph., 8, 29(1988).

Set citation alerts for the article
Please enter your email address
© Copyright 2018-2021 | Chinese Laser Press. All Rights Reserved 沪ICP备15018463号-20