 ) coefficients for YCOB and BiBO[
Mario Galletti, Hugo Pires, Victor Hariton, Joana Alves, Pedro Oliveira, Marco Galimberti, Gonçalo Figueira. Ultra-broadband near-infrared NOPAs based on the nonlinear crystals BiBO and YCOB[J]. High Power Laser Science and Engineering, 2020, 8(3): 03000e29
- High Power Laser Science and Engineering
- Vol. 8, Issue 3, 03000e29 (2020)
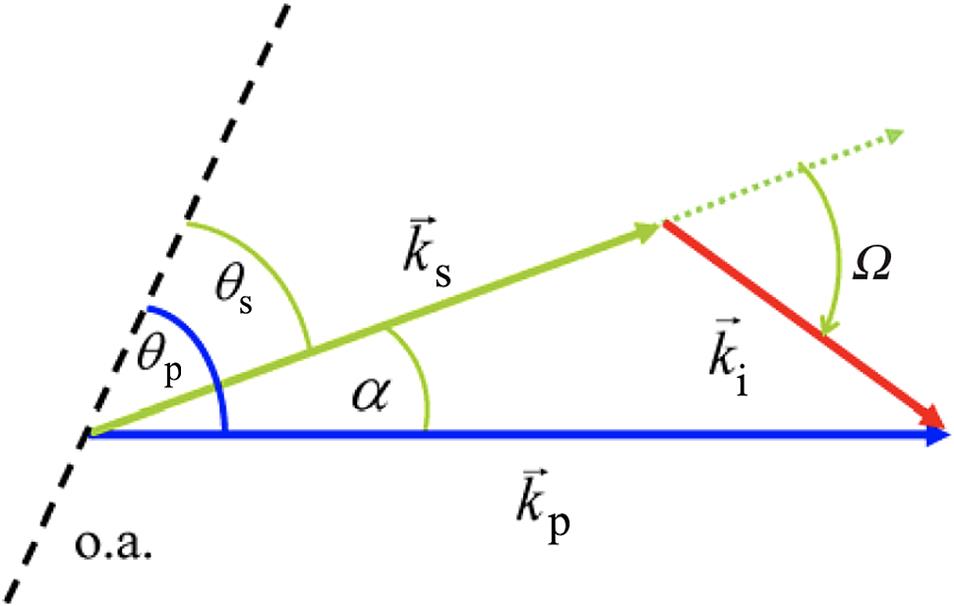
Fig. 1. Representation of noncollinear phase-matching condition. o.a. is the crystal optic axis.
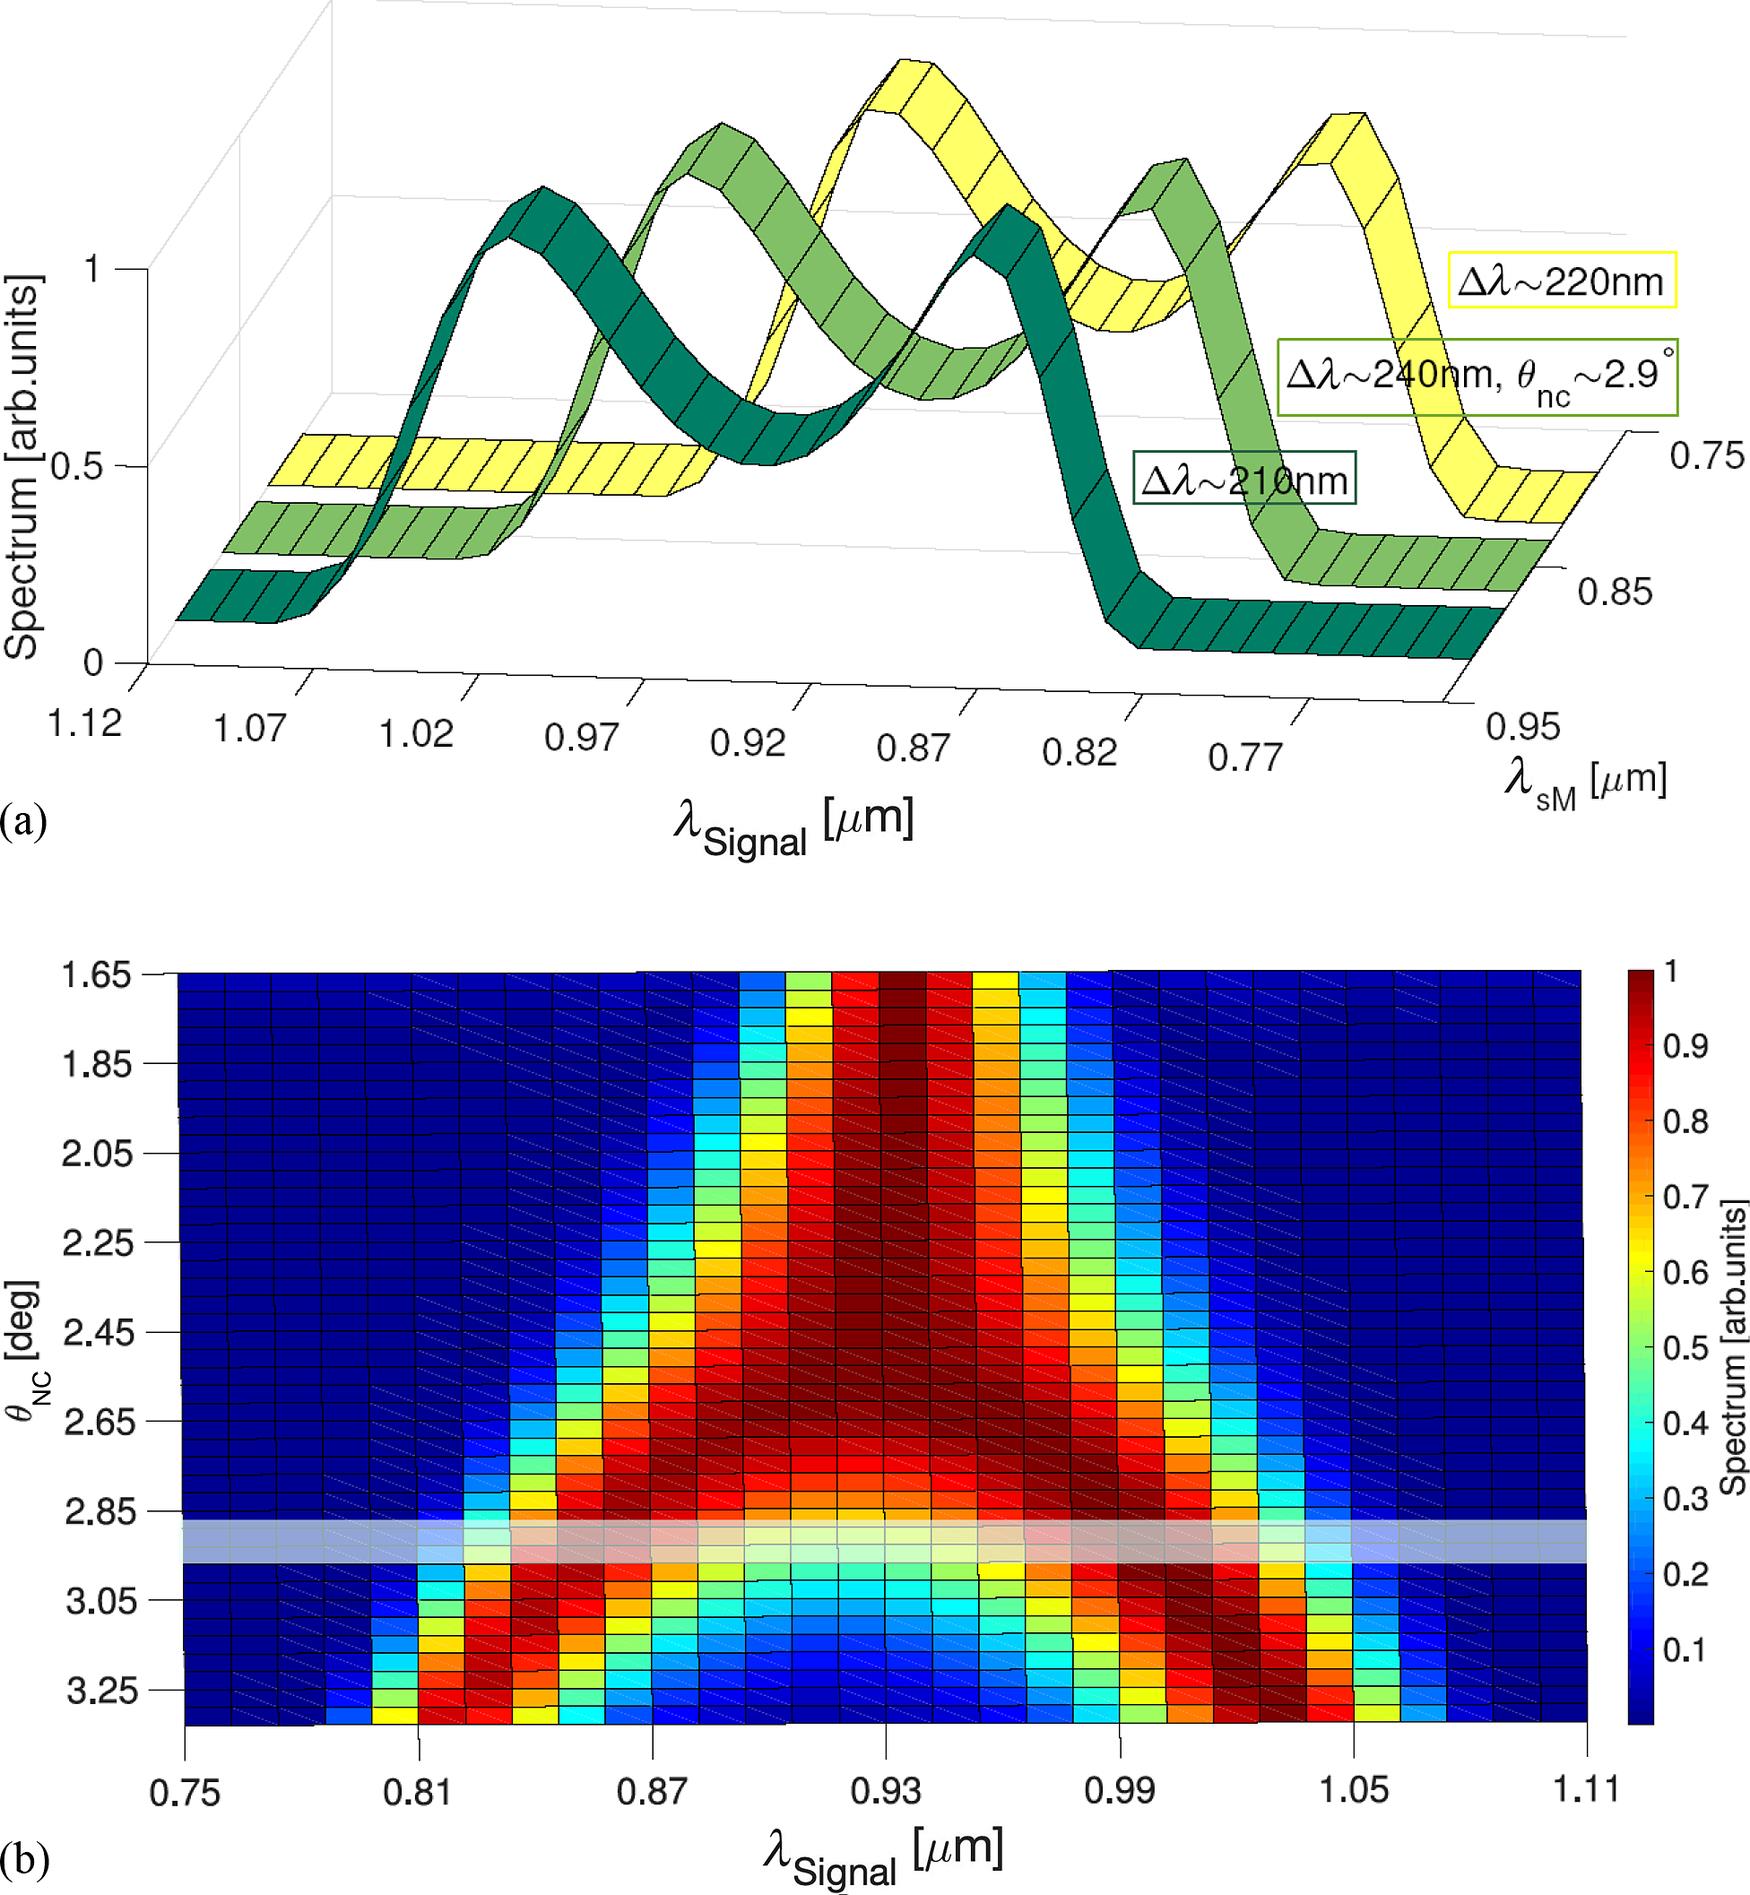
Fig. 2. Parametric scan for the BiBO nonlinear crystal. (a) Simulated phase-matched wavelength (λ sM) dependence of the amplified spectrum. The crystal thickness is 2.5 mm and the pump intensity is ~50 GW/cm2. (b) Simulated noncollinear angular dependence of the amplified spectrum over a range ~1.6. The crystal thickness is 2.5 mm and the pump intensity is ~50 GW/cm2. The box (translucent white) highlights the region of interest where the bandwidth is maximized but the central region (~0.9 μm) is not heavily depleted.
Fig. 3. Simulated amplification spectrum for a 5 mm YCOB crystal pumped at 515 nm with an intensity of ~50 GW/cm2.
Fig. 4. Simulated noncollinear angular dependence of the BiBO amplified spectrum. Crystal thickness is 2.5 mm and the pump intensity is ~50 GW/cm2.
Fig. 5. Schematic of the OPCPA chain used for crystal comparison. SHG, second harmonic generation; WLG, white light generation.
Fig. 6. Noncollinear OPA stage seed: supercontinuum generation.
Fig. 7. Experimental results for the YCOB NOPA stage compared to theoretical analysis. Amplified spectra for (a) 5 mm, (b) 7.5 mm and (c) 15 mm crystals. The shadowed curve is the numerically calculated amplified spectrum for the following parameters: λ p = 515 nm, I p ~50 GW/cm2, d eff = 5, 7.5, 15 mm YCOB crystal thicknesses, and the signal and crystal angles are those reported in Table 2 .
Fig. 8. Experimental results for the BiBO NOPA stage: amplified spectrum for a 2.5 mm crystal. Different noncollinear angles are plotted to show the influence of θ NC on the spectral dip around 920 nm.
Fig. 9. Theoretical amplified spectrum for LBO and BBO crystals in a noncollinear geometry to maximize the bandwidth.
|
|
Table 2. Parameters for the nonlinear crystals BiBO and YCOB to obtain broadband amplification. θC (°) and ϕ (°) are the crystal angles for perfect phase matching, deff (pm/V) is the nonlinear efficiency, θNC (°) is the noncollinear angle and LC (mm) is the crystal length.

Set citation alerts for the article
Please enter your email address
© Copyright 2018-2021 | Chinese Laser Press. All Rights Reserved 沪ICP备15018463号-20