• Chinese Optics Letters
  • Vol. 21, Issue 1, 010004 (2023)
Qi'ao Dong, Wenqi Wang, Xinyi Cao, Yibo Xiao, Xiaohan Guo, Jingxuan Ma, Lianhui Wang**, and Li Gao*
Author Affiliations
  • State Key Laboratory for Organic Electronics and Information Displays, Institute of Advanced Materials, School of Materials Science and Engineering, Nanjing University of Posts and Telecommunications, Nanjing 210023, China
  • show less
    DOI: 10.3788/COL202321.010004 Cite this Article Set citation alerts
    Qi'ao Dong, Wenqi Wang, Xinyi Cao, Yibo Xiao, Xiaohan Guo, Jingxuan Ma, Lianhui Wang, Li Gao. Plasmonic nanostructure characterized by deep-neural-network-assisted spectroscopy [Invited][J]. Chinese Optics Letters, 2023, 21(1): 010004 Copy Citation Text show less
    Schematic diagram of the nanostructure characterization process and studied parameters. (a) Process flow of nanostructure characterization process; (b) periodic nanohole and nanopillar plasmonic nanostructure formed by nanoimprint lithography on glass substrate; (c) representative SEM images of the experimental samples of (b); (d) Au, Ag, and Al metal films evaporated on the structures; (e) dielectric coating covered on the structures to be identified for its refractive index.
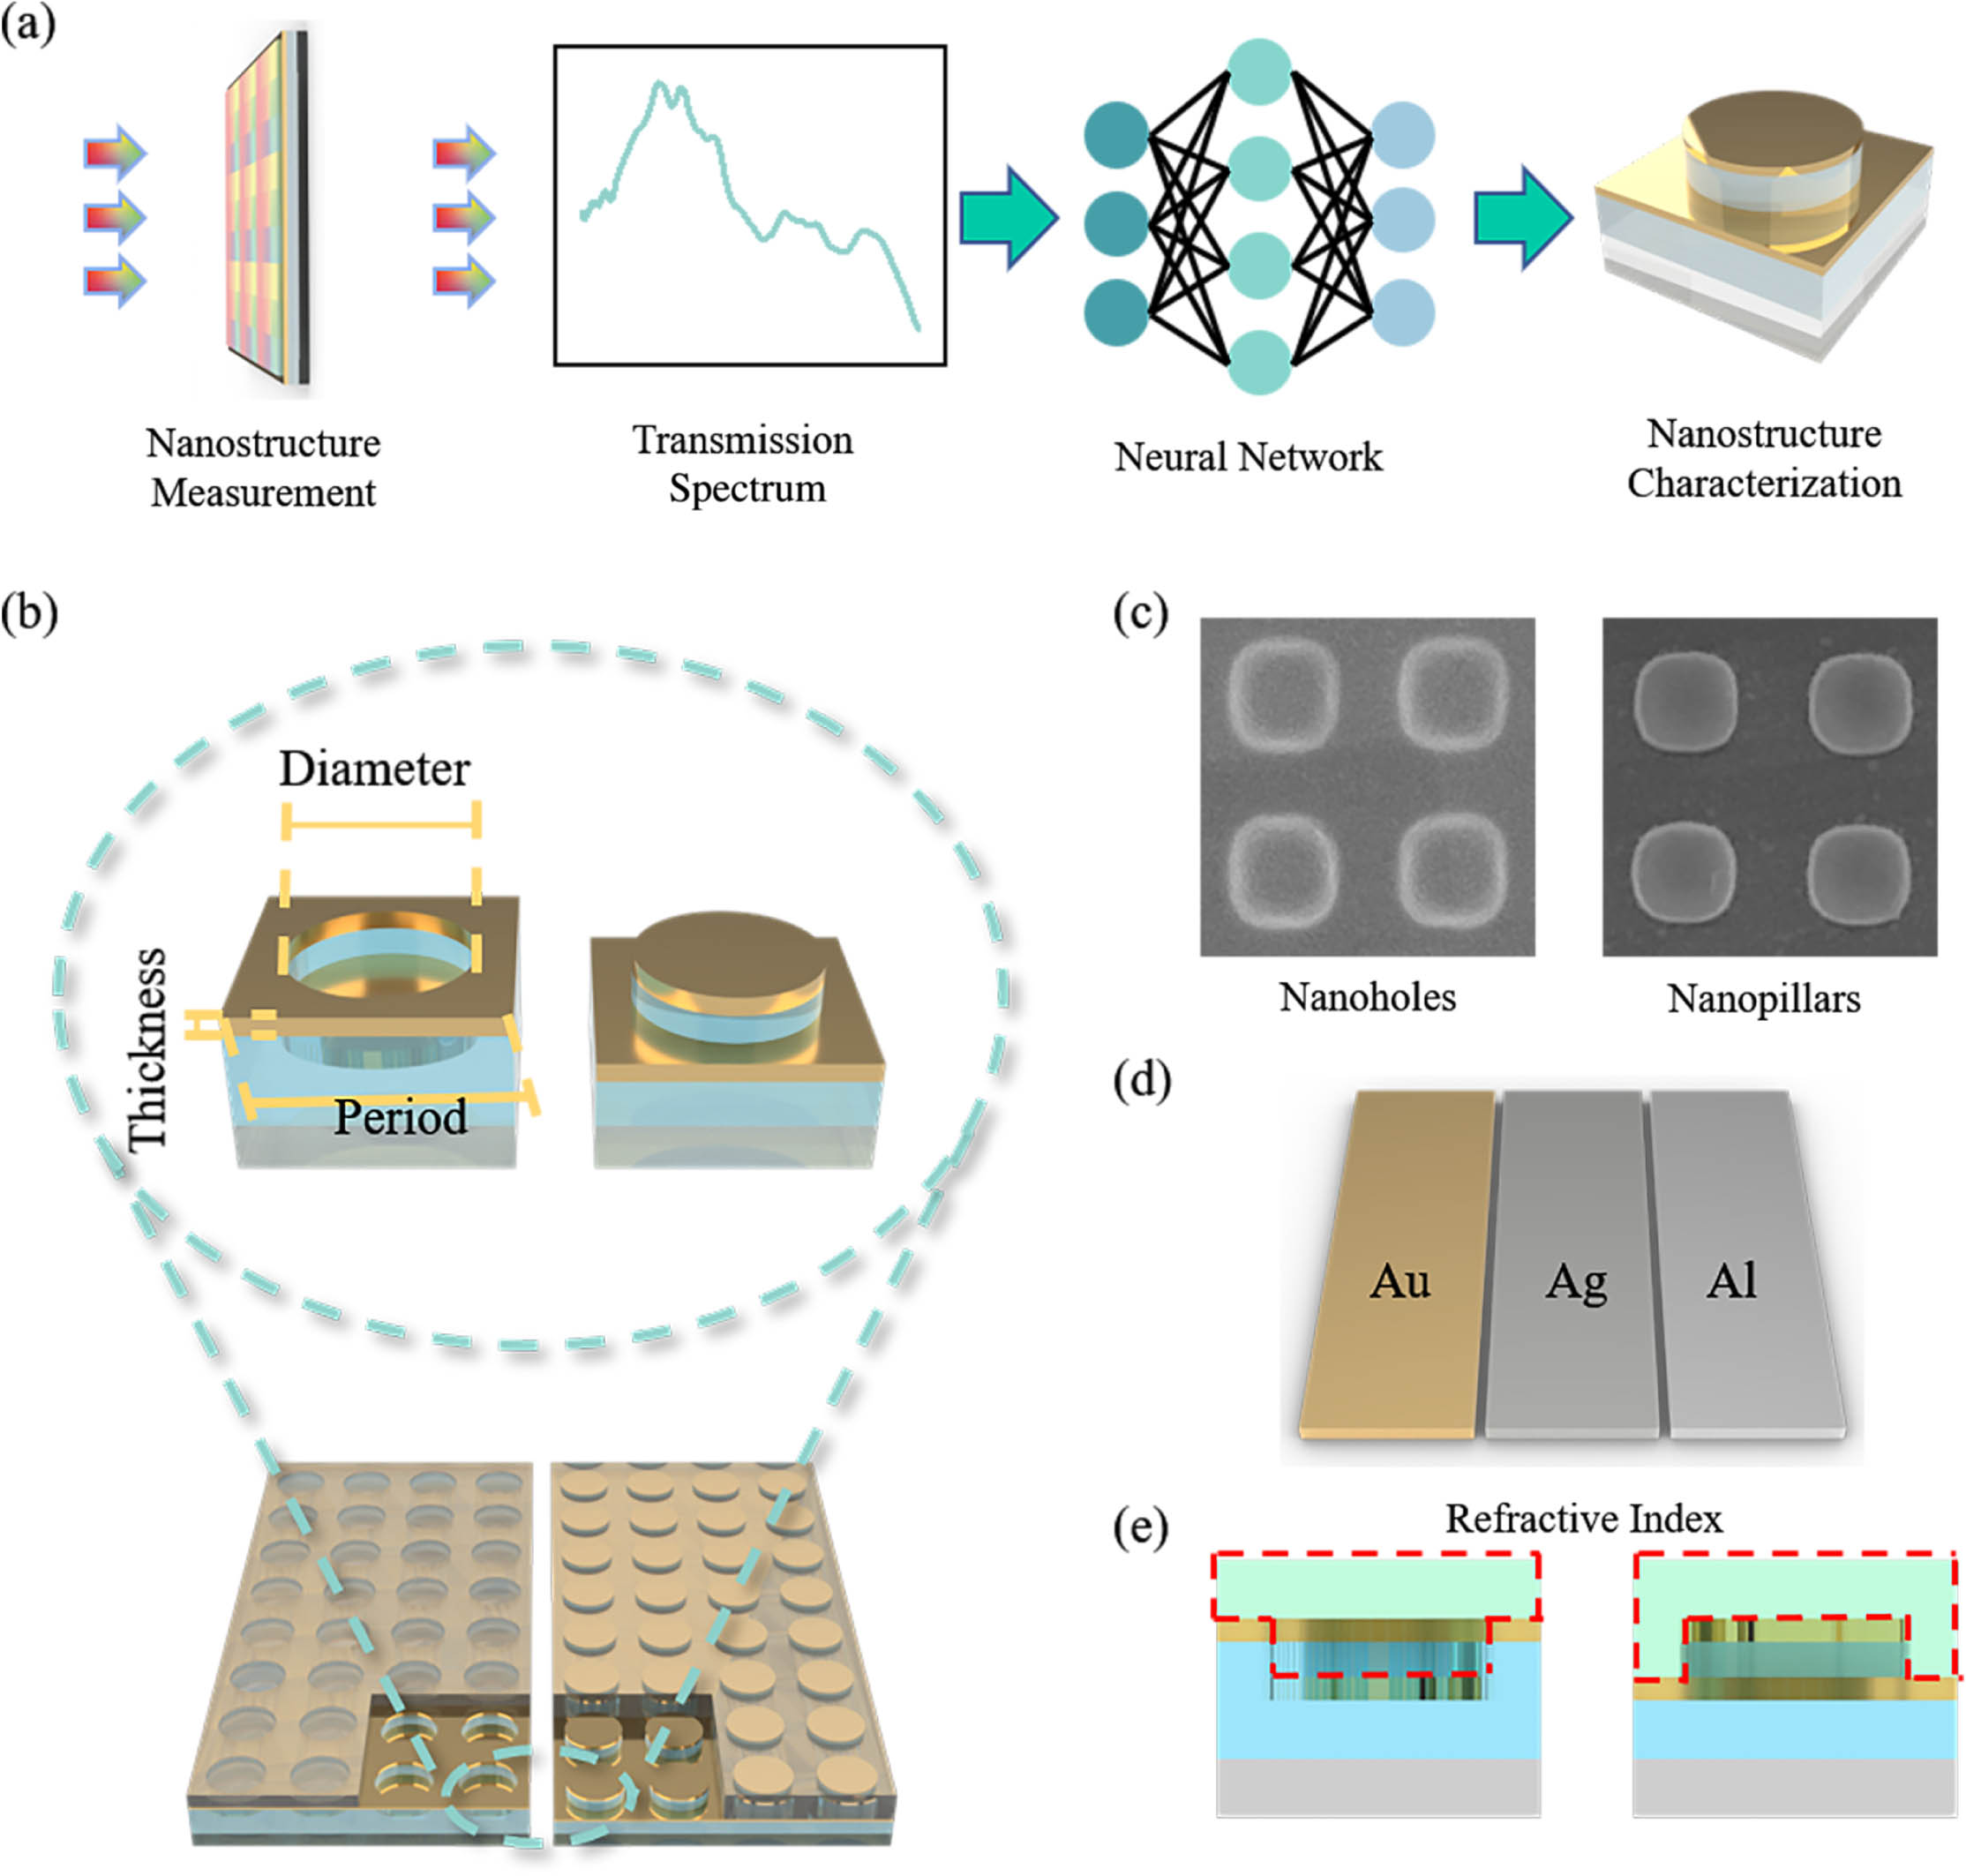
    Fig. 1. Schematic diagram of the nanostructure characterization process and studied parameters. (a) Process flow of nanostructure characterization process; (b) periodic nanohole and nanopillar plasmonic nanostructure formed by nanoimprint lithography on glass substrate; (c) representative SEM images of the experimental samples of (b); (d) Au, Ag, and Al metal films evaporated on the structures; (e) dielectric coating covered on the structures to be identified for its refractive index.
    Results of DNN1. (a) The architecture of DNN1. The input layer has 201 neurons and the output layer has four neurons; there are five hidden layers. (b)–(d) The absolute error of the testing data set, where (b) is for diameter, (c) is for thickness, and (d) is for period. (e) Relative error of the testing data set; (f) example of two transmission spectra of the real structure and the predicted structure, with an MSE slightly higher than the mean value.
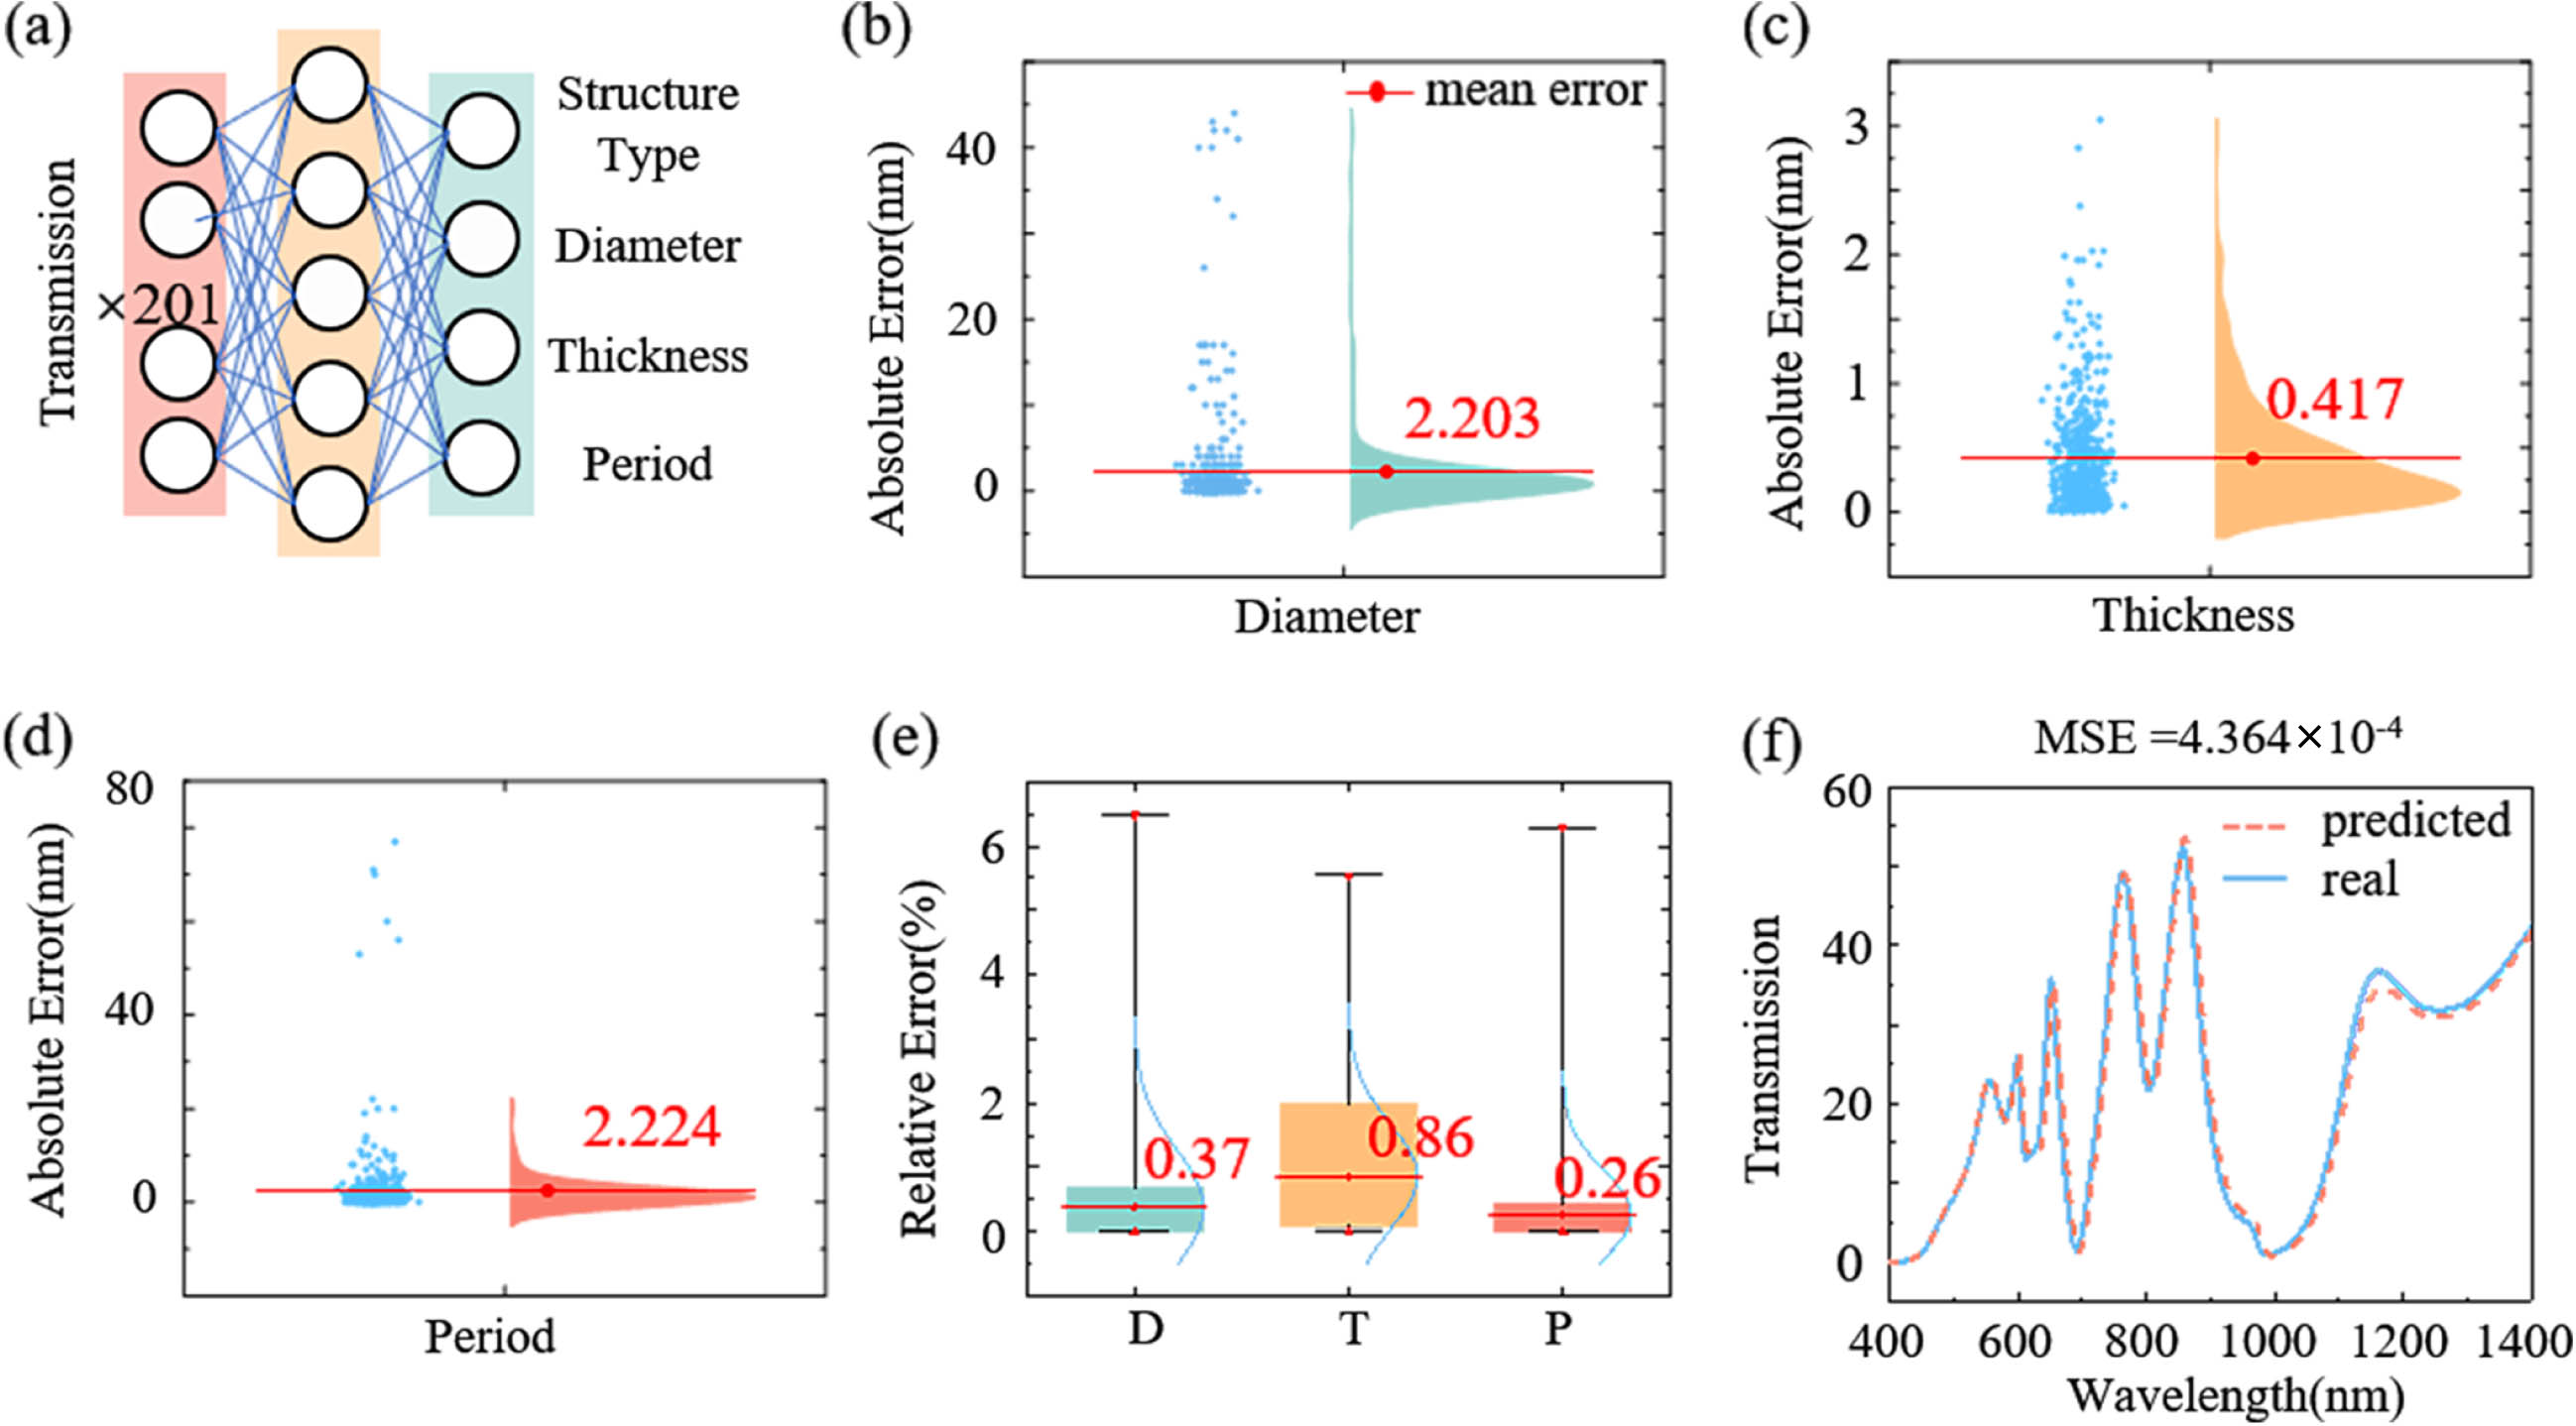
    Fig. 2. Results of DNN1. (a) The architecture of DNN1. The input layer has 201 neurons and the output layer has four neurons; there are five hidden layers. (b)–(d) The absolute error of the testing data set, where (b) is for diameter, (c) is for thickness, and (d) is for period. (e) Relative error of the testing data set; (f) example of two transmission spectra of the real structure and the predicted structure, with an MSE slightly higher than the mean value.
    Results of DNN3. (a) The architecture of DNN3. The input layer has 201 neurons and the output layer has six neurons; there are five hidden layers. (b)–(e) The absolute error of the testing data set, where (b) is for diameter, (c) is for thickness, (d) is for period, and (e) is for the dielectric coating refractive index. (f) Relative error of the testing data set; (g) example of two transmission spectra of the real structure and the predicted structure, with an MSE slightly higher than the mean value.
    Fig. 3. Results of DNN3. (a) The architecture of DNN3. The input layer has 201 neurons and the output layer has six neurons; there are five hidden layers. (b)–(e) The absolute error of the testing data set, where (b) is for diameter, (c) is for thickness, (d) is for period, and (e) is for the dielectric coating refractive index. (f) Relative error of the testing data set; (g) example of two transmission spectra of the real structure and the predicted structure, with an MSE slightly higher than the mean value.
    Results of DNN4. (a) The architecture of DNN4. The input layer has 201 neurons and the output layer has seven neurons; there are five hidden layers. (b) SEM images of nanohole and nanopillar structures prepared by nanoimprint lithography; (c) comparison of the experimental and simulated spectra; the yellow line indicates that the dielectric layer material is SU8, while the blue one indicates the air. (d) The absolute error of the testing data set; the top is the experimental data group, and the bottom is the total mixed data. (e) The relative error of the testing data set; the top is the experimental data, and the bottom is the total mixed data. (f) Statistics of the number of predictions that successfully identify the data type (experimental or simulated), structure type (nanohole or nanopillar), metal type, metal film thickness, and refractive index of dielectric layer collected for experimental data.
    Fig. 4. Results of DNN4. (a) The architecture of DNN4. The input layer has 201 neurons and the output layer has seven neurons; there are five hidden layers. (b) SEM images of nanohole and nanopillar structures prepared by nanoimprint lithography; (c) comparison of the experimental and simulated spectra; the yellow line indicates that the dielectric layer material is SU8, while the blue one indicates the air. (d) The absolute error of the testing data set; the top is the experimental data group, and the bottom is the total mixed data. (e) The relative error of the testing data set; the top is the experimental data, and the bottom is the total mixed data. (f) Statistics of the number of predictions that successfully identify the data type (experimental or simulated), structure type (nanohole or nanopillar), metal type, metal film thickness, and refractive index of dielectric layer collected for experimental data.
     Regression ProblemsClassification Problems
    ParametersAccuracyParametersTruth
    >90%>95%>98%
    DNN1 Data size: 525Diameter525517500Structure type525
    Period525523474
    Thickness525519517
    DNN2 Data size: 735Diameter735727674Structure type735
    Period735735735Dielectric coating727
    Thickness729727712
    DNN3 Data size: 3969Diameter396638573415Structure type3950
    Period396939513829Metal type3805
    Thickness362135233413
    Refractive index394139333925
    DNN4 Data size: 4008Diameter399238423265Structure type3997
    Period399339573784Metal type3822
    Thickness359634413261Data type4008
    Refractive index398139473903
    Table 1. Statistics of Characterization Error Distribution of DNNs
    Qi'ao Dong, Wenqi Wang, Xinyi Cao, Yibo Xiao, Xiaohan Guo, Jingxuan Ma, Lianhui Wang, Li Gao. Plasmonic nanostructure characterized by deep-neural-network-assisted spectroscopy [Invited][J]. Chinese Optics Letters, 2023, 21(1): 010004
    Download Citation