
Yueqing Du, Chao Zeng, Zhiwen He, Qun Gao, Dong Mao. Coherent dissipative soliton intermittency in ultrafast fiber lasers[J]. Chinese Optics Letters, 2022, 20(1): 011401
- Chinese Optics Letters
- Vol. 20, Issue 1, 011401 (2022)
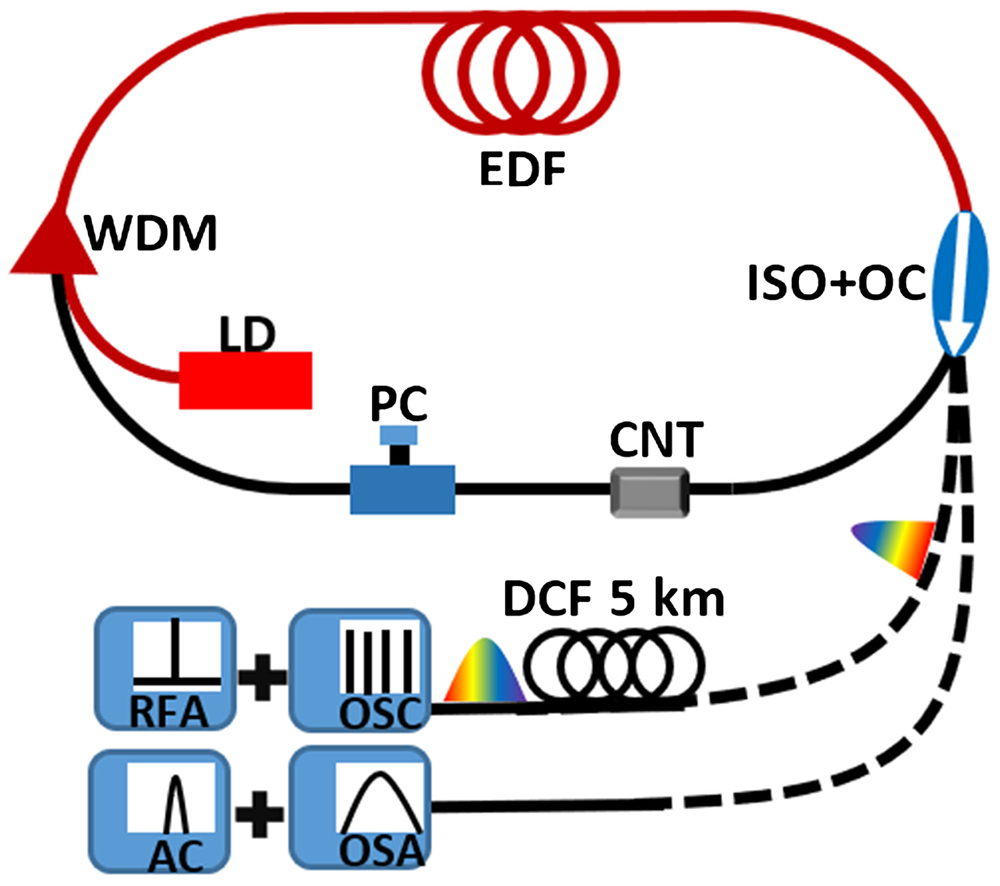
Fig. 1. Schematic of the fiber laser. EDF, Er-doped fiber; ISO, isolator; OC, output coupler; CNT, carbon nanotube; PC, polarization controller; LD, laser diode; WDM, wavelength division multiplexer; DCF, dispersion compensation fiber; OSC, oscilloscope; RFA, radio frequency analyzer; OSA, optical spectrum analyzer; AC, autocorrelator.
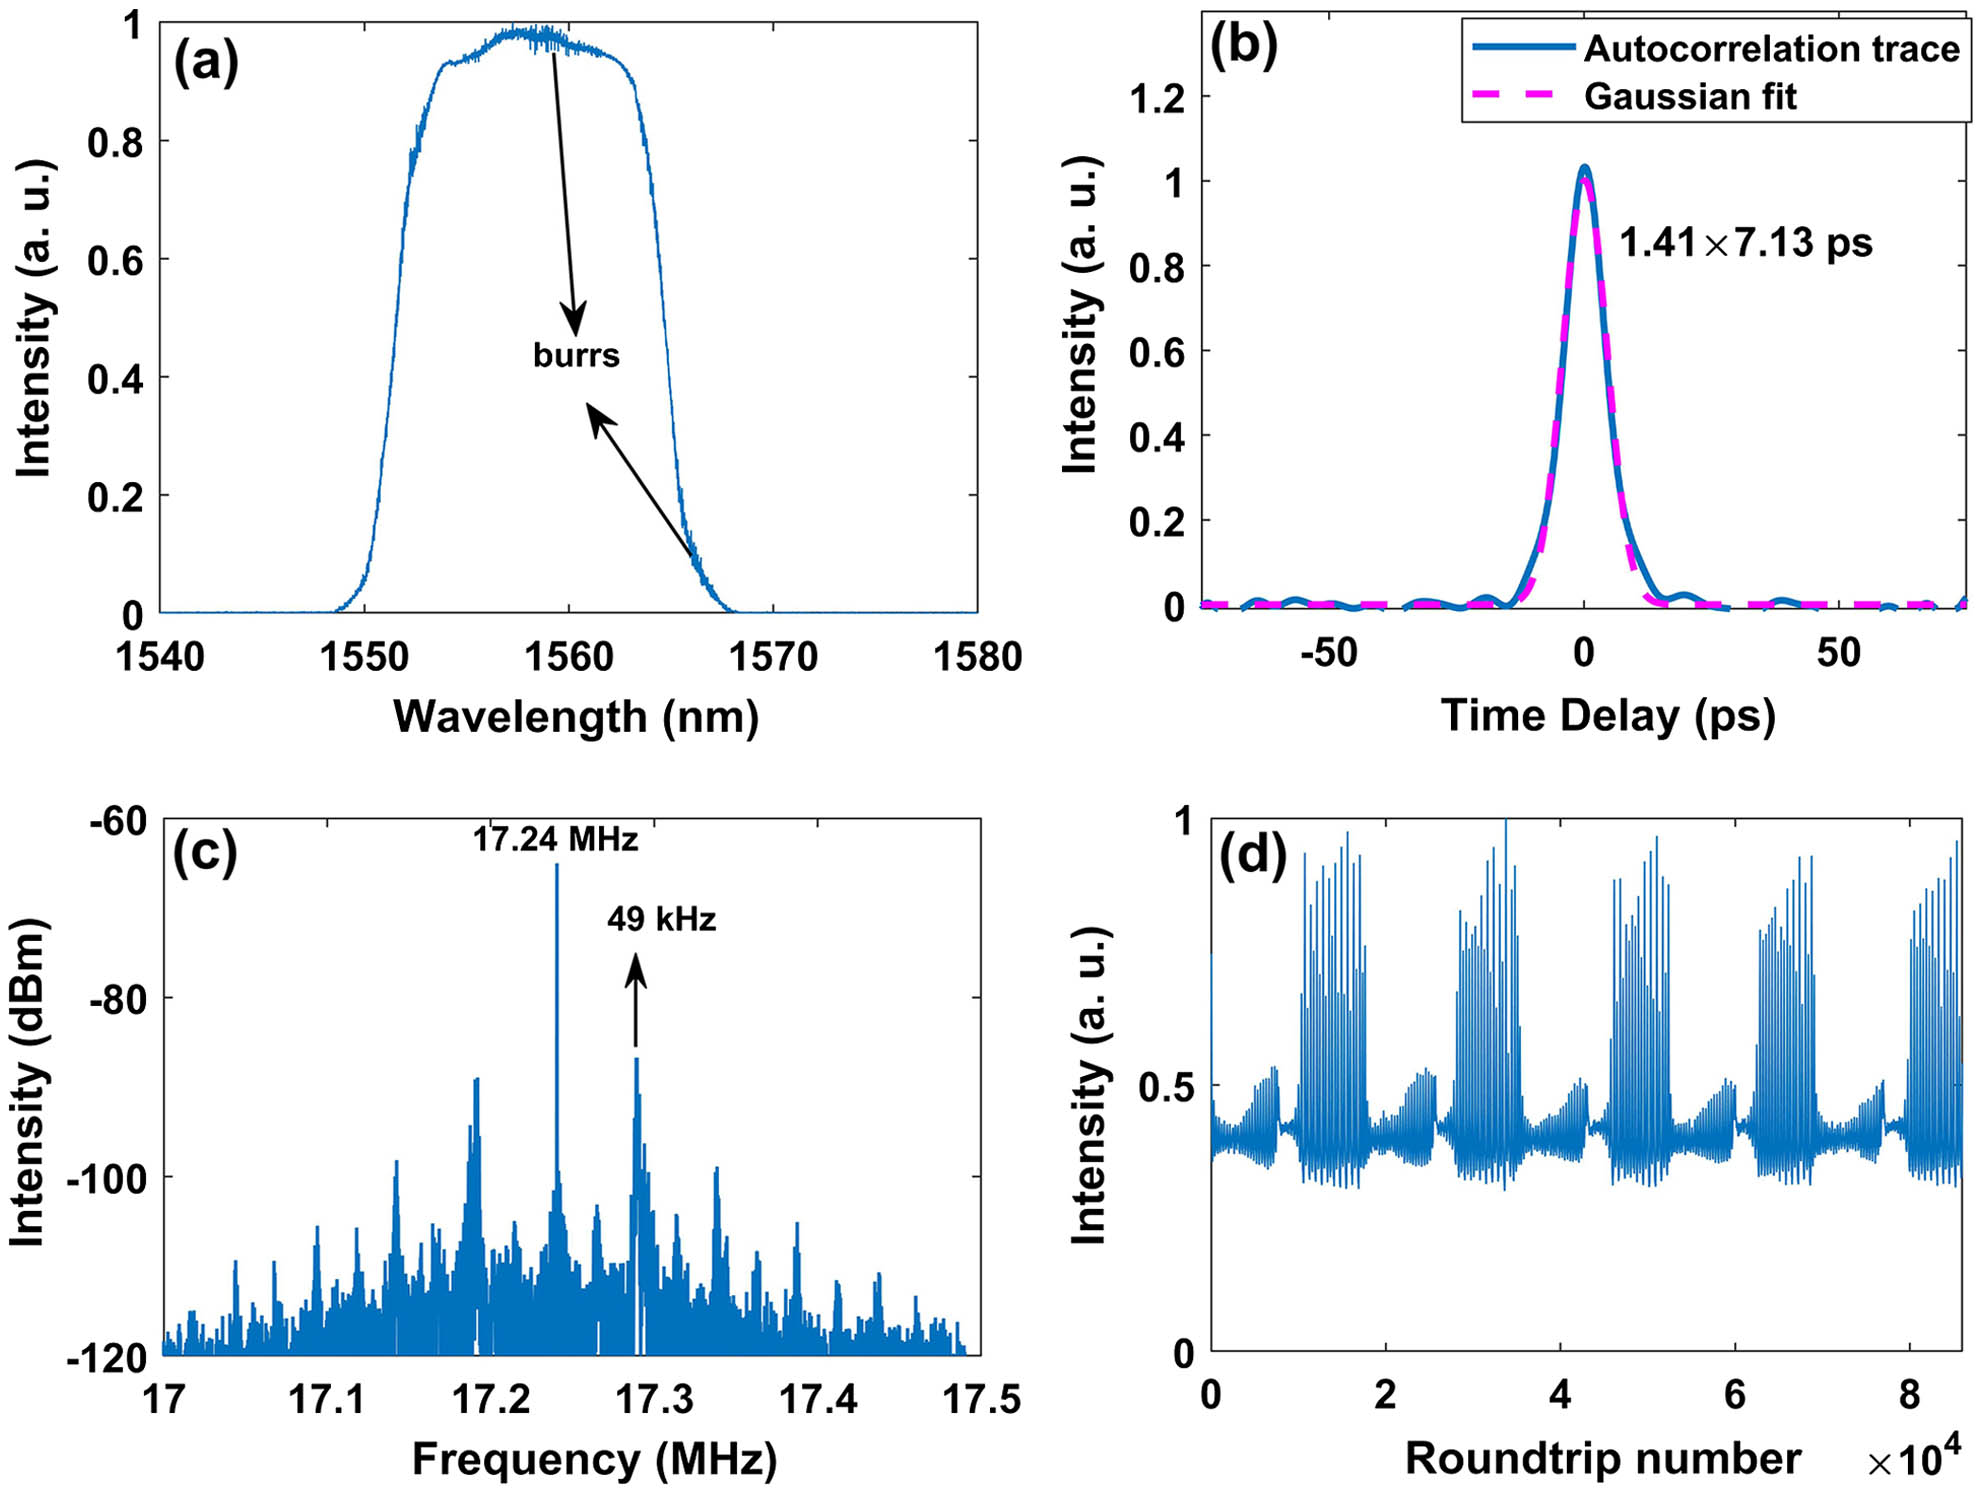
Fig. 2. Mode-locking state at the pump power of 25.35 mW. (a) Spectrum measured by OSA, (b) autocorrelation trace, (c) RF spectrum, and (d) peak intensity evolution of the normalized DFT signals over 85,000 RTs.
Fig. 3. Shot-to-shot evolution of the pulse at the pump power of 25.35 mW. (a) Intensity evolution of normalized DFT signals over 16,000 RTs, (b) spatial-spectral evolution, (c) averaged spectrum measured by DFT, (d) local enlargement of the marked area, and (e) single-shot spectra at three RTs.
Fig. 4. Spectral intensity evolution of the normalized DFT signals over 80,000 RTs at different pump powers: (a) 24.39 mW, (b) 25.35 mW, (c) 26.32 mW, (d) 28.20 mW, (e) 29.21 mW, and (f) 31.95 mW.
Fig. 5. Pulse state at the pump power of 31.95 mW. (a) Optical spectrum measured by OSA, (b) RF spectrum, (c) center wavelength and intensity evolution, and (d) shot-to-shot evolution.
Fig. 6. Random mode locking at the pump power of 32.85 mW. (a) Optical spectrum measured by OSA, (b) shot-to-shot evolution of the time-stretch signals, and (c) enlargement of the marked areas in (b).

Set citation alerts for the article
Please enter your email address
© Copyright 2018-2021 | Chinese Laser Press. All Rights Reserved 沪ICP备15018463号-20